Fig. 4.
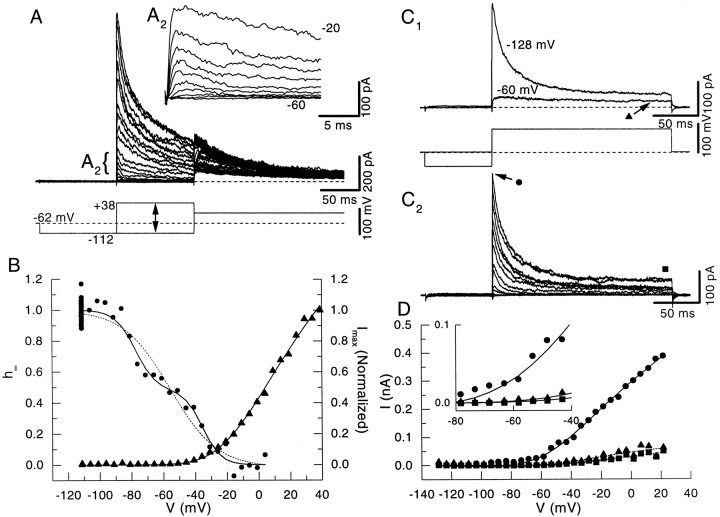
Voltage dependence of activation and inactivation of transient currents in outside-out patches from DCN pyramidal cells.A, Voltage command and current traces from one outside-out patch used to study activation and inactivation. The range of command voltages is indicated by the line withtwo arrows. A2,Inset showing the rapid activation of the currents.B, Fits from peak currents in A to Boltzmann functions. Activation is shown on the right;filled triangles are the measured values from the peak current in A, and the line is the best fit modified Boltzmann. Inactivation is shown on theleft; filled circles are the normalized peak current measured during the final step in A and are plotted as a function of the voltage during the preceding variable step. The dashed line is the fit of a single Boltzmann function to the data. However, the data were better described by the sum of two Boltzmann functions (solid line) (see Results). C1, Steps to 0 mV preceded by prepulses to −128 or −60 mV. The rapid inactivating outward current is reduced significantly by the prepulse to −60 mV.C2, Difference of currents elicited in C1 reveals a fast transient outward current. D, The filled circles show the voltage dependence of the peak current. The peak current activates near the resting potential. The filled triangles and squares show the voltage dependence of the slow (from C1) and noninactivating (from C2) components. These currents activate at a more depolarized voltage, as shown in the inset.

