
Fig. 5.
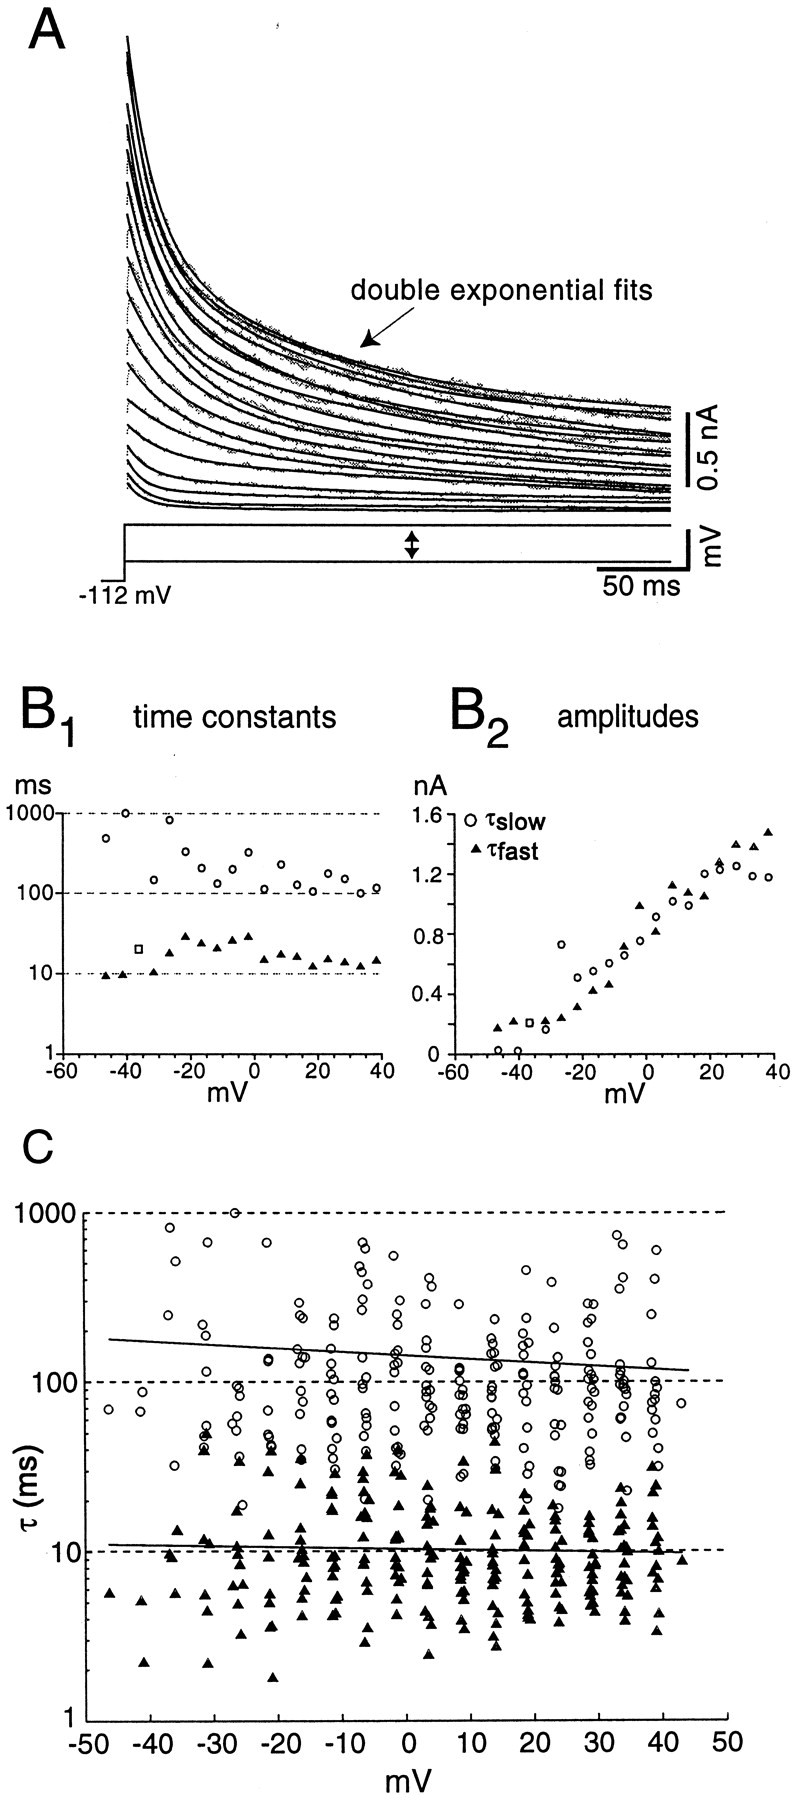
Inactivation kinetics of transient currents in outside-out patches reveal two components. A, Fits of the sum of two exponential decay functions to the decay phase of the currents elicited by a series of voltage steps.B1, Time constants for the fast and slow components of decay. The open squares indicate voltages at which the data were fit with a single exponential.B2, Amplitude of the two time constants for the fits to the data in A. C, Summary of kinetics for 23 patches with double-exponential fits. The regression line (solid line) for the fast component (filled triangles) is τ = 10.4 − 0.01 ·V (R = 0.02), and the regression for the slow component (open circles) is τ = 145.4 − 0.73 · V (R = 0.10).