
Fig. 7.
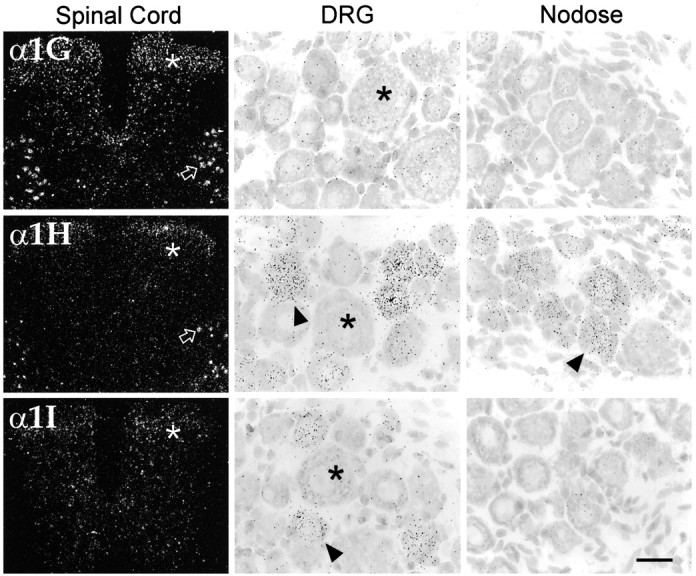
Differential accumulation of CaVT transcripts in the spinal cord and sensory ganglia. Left panels show low-power dark-field images of transverse sections through the lumbar spinal cord. All three transcripts were present in the dorsal horn (asterisks), with α1H mRNA limited to neurons of the external lamina. Note also that α1G and α1H were expressed in motor neurons in the ventral horn (open arrows). Middle panels show high-power bright-field images of dorsal root ganglia (DRG) neurons. Probes for α1H and α1I labeled small- and medium-sized neurons (arrowheads); in contrast, large neurons (asterisks) were unlabeled. In the nodose ganglia (right panels) expression was for the most part limited to α1H (arrowhead). Scale bar, 400 μm (left panels); 25 μm (middle and right panels).