
Fig. 7.
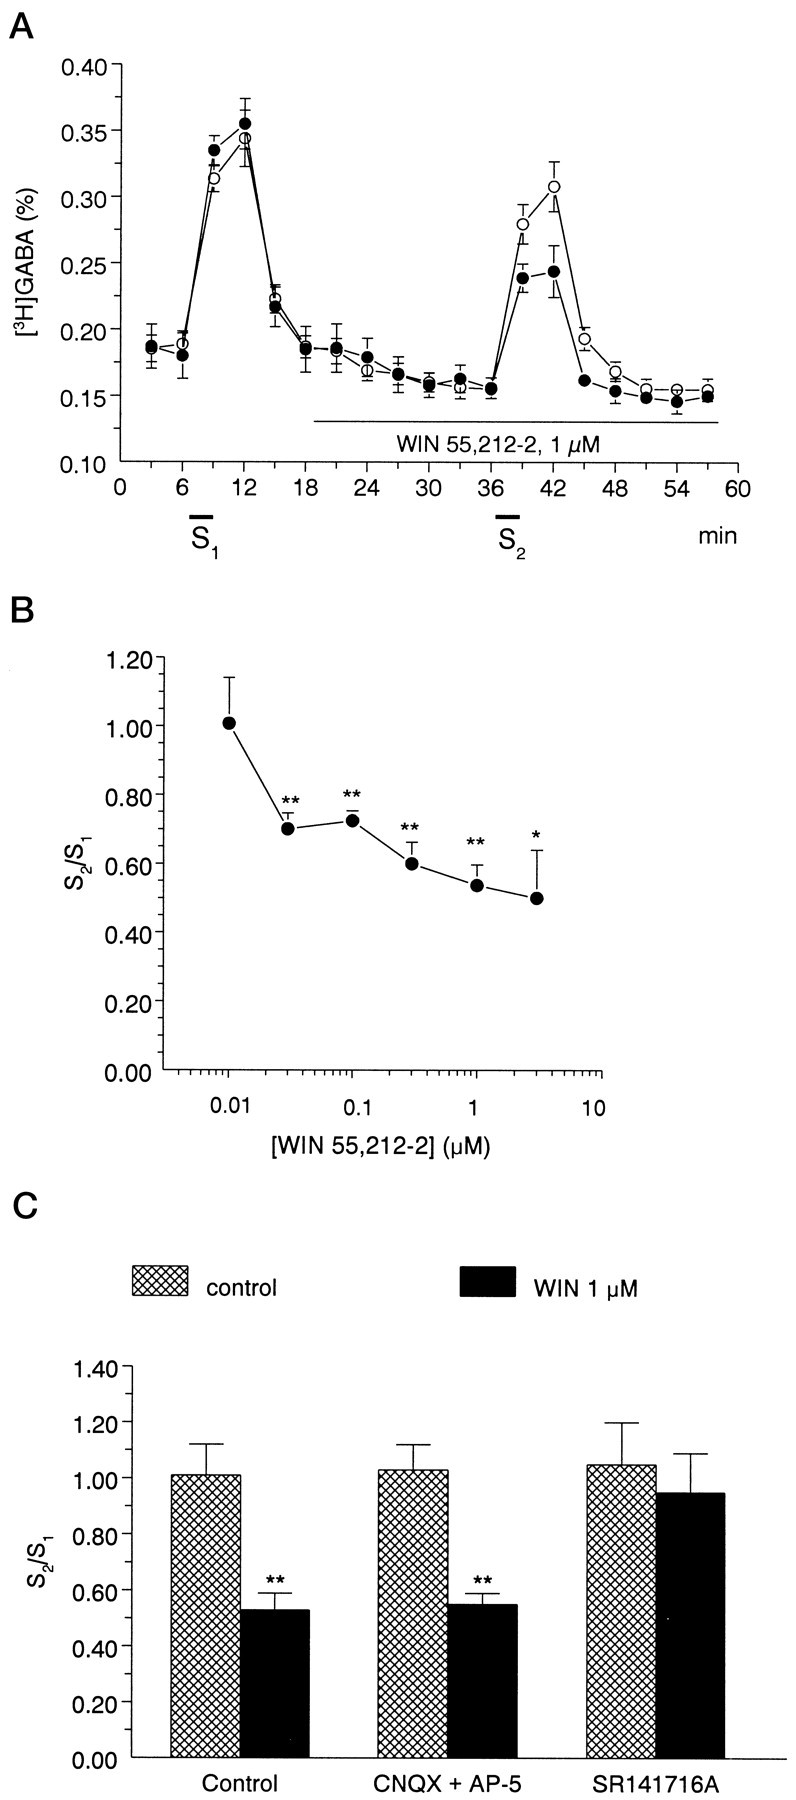
A, A cannabinoid agonist, 1 μmWIN55,212-2, inhibits electrically evoked [3H]GABA release from rat hippocampal slices. The slices were superfused for 60 min at a rate of 0.7 ml/min. After the preperfusion period, 3 min samples were collected and assayed for radioactivity. [3H]GABA release was significantly increased in response to electrical field stimulation (S1, S2). Open circles represent control experiments; filled circles show experiments when WIN 55,212-2 was present during the second stimulation period (S2). The release of [3H]GABA was expressed as fractional release (%; for calculation see Materials and Methods). The values show the mean ± SEM of 7–12 identical experiments. B, Concentration dependence of the effect of WIN55,212-2 on stimulation-induced [3H]GABA release from rat hippocampal slices. The cannabinoid receptor agonist WIN 55,212-2 was applied to the slices by perfusion according to the protocol shown in Ain different concentrations ranging from 0.01 to 3 μm, and its effect on stimulation-evoked [3H]GABA outflow was expressed as S2/S1 ratios (for calculation, see Materials and Methods). The values show the mean ± SEM of 7–12 identical experiments. Asterisksrepresent significant differences from the control S2/S1 ratio, measured in the absence of drugs (1.01 ± 0.11, n = 12), calculated by ANOVA followed by the Dunnett test (*p < 0.05, **p < 0.01). C, Interaction of the effect of WIN55,212-2 on stimulation-induced [3H]GABA release with glutamate receptor antagonists AP-5 and CNQX and with the CB1 receptor antagonist SR141716A in rat hippocampal slices. The effect of drugs on stimulation-induced release of [3H]GABA was expressed as S2/S1 ratio, measured in the absence (cross-hatched bars) and presence of WIN55,212-2 (black bars). The perfusion with WIN55,212-2 (1 μm) started 18 min before S2 and continued thereafter, whereas AP-5 (10 μm), CNQX (10 μm), and SR141716A (1 μm) were perfused from 15 min before S1. Data show the mean ± SEM of 6–12 identical experiments. Asterisks represent significant difference from respective controls (**p < 0.01 calculated by Student’s t test).