Fig. 3.
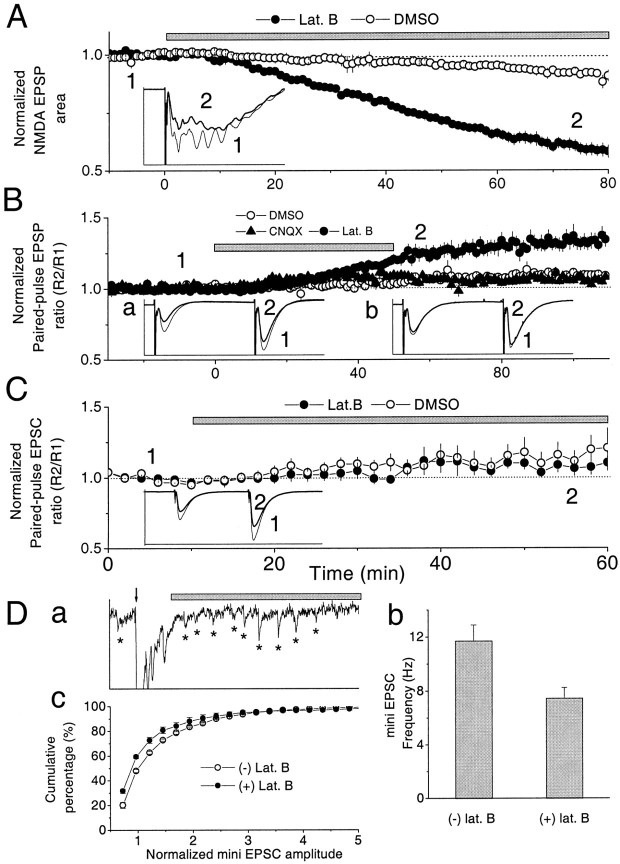
Experiments indicating that there is a presynaptic site of action of bath-applied latrunculin B. A, The NMDAR-mediated synaptic transmission was also reduced by latrunculin B. The area of the NMDAR-mediated fEPSP was measured with ACSF containing 0.1 mm Mg2+ in which 10 μmCNQX was used to block AMPAR-mediated synaptic transmission. Thebar indicates the period of drug application. Latrunculin B (2 μm) was applied 10 min after baseline recording (n = 6). As a control, 0.1% DMSO ACSF was used (n = 3). Inset, Average fEPSP before (thin trace, 1) and after (thick trace, 2) latrunculin B application. The spiking always appeared at this stimulation condition (0.1 mm Mg2+, 2.5 mmCa2+, 2.5 mm KCl, and 50 μm picrotoxin in ACSF, and without CA3 region in slice) and was blocked by APV (data not shown; Bortolotto and Collingridge, 1998). Calibration: 2 mV, 100 msec. B, Paired-pulse facilitation quantified by the ratio of the initial slopes of two fEPSPs at 50 msec interval. The bar indicates the duration of drug application. Latrunculin B (2 μm) was applied for 50 min after 20 min of baseline recording (n = 7). The average PPF ratios at 5–10 min after washout of DMSO control, 0.3 μm CNQX, and latrunculin B experiments were 1.07 ± 0.009, 1.06 ± 0.02, and 1.25 ± 0.03 (mean ± SE), respectively. Inset a, Examples of average responses before (thin line,1) and after (thick line,2) 2 μm latrunculin B application.Inset b, Before (thin line,1) and after (thick line,2) 0.3 μm CNQX application. Calibration: 3.5 mV, 90 msec. C, Effects of postsynaptically applied latrunculin B on PPF as measured using whole-cell recording. Thebar indicates the duration of drug application to the postsynaptic cell. Latrunculin B (100 μm) was applied after 10 min of baseline recording (n = 7). As a control, 0.2% DMSO internal solution (n = 4) was applied. The effect of latrunculin B on PPF was not significantly different from that of DMSO control 50 min after drug application (t test; p ≫ 0.05).Inset, Two example average traces before (thin line, 1) and after (thick line, 2) 100 μm latrunculin B application. Calibration: 800 pA, 120 msec. D, Effect of bath-applied 4 μm latrunculin B on evoked mEPSCs. a, An evoked EPSC trace is shown. The arrow indicates when the stimulus was given. The period marked by the gray bar was used for analysis (asterisk indicates mEPSCs). One hundred traces were acquired for each experiment. Calibration: 100 pA, 500 msec. A higher concentration of latrunculin B than in Figure 1 was used to speed the onset of the effect. b, Latrunculin B significantly reduced mEPSC frequency by 36%. c, Cumulative distribution of mEPSC amplitude. Latrunculin B reduced the average mEPSC amplitude by 9%. Amplitude was normalized to 50% of cumulative percentage in the control condition.

