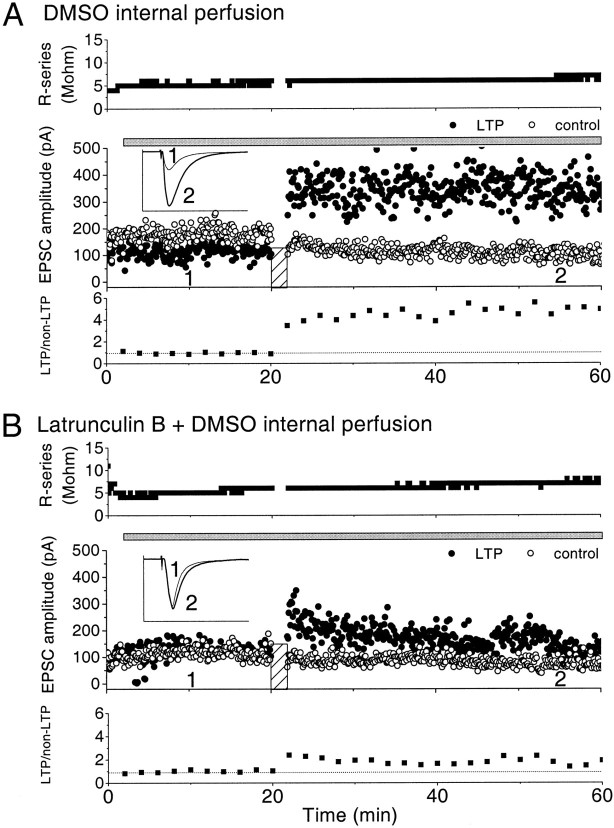
Fig. 5.
Representative experiments in which effects on LTP induction of postsynaptic DMSO or latrunculin B were measured.Gray bar indicates the period of internal perfusion of latrunculin B or DMSO through perfusion pipette. Hatched box indicates the period of pairing. A, An experiment in which 0.1% DMSO internal solution was applied for 18 min, and LTP was then induced by pairing. Inset, Averagetraces for 10 min before (thin line,1) and after (thick line,2) pairing. Calibration: 400 pA, 60 msec. Top panel shows the measurement of series resistance for the recording. Middle panel shows the magnitude of EPSC as a function of time. Bottom panel shows the ratio of amplitude of LTP over non-LTP path synaptic responses. Each point is the average of 20 traces. B, An experiment in which 200 μm latrunculin B (in 0.1% DMSO) was applied postsynaptically. Eighteen minutes later, LTP was induced by pairing.Inset, Average trace 10 min before (thin line, 1) and after (thick line, 2) pairing. Calibration: 250 pA, 60 msec.

