Fig. 6.
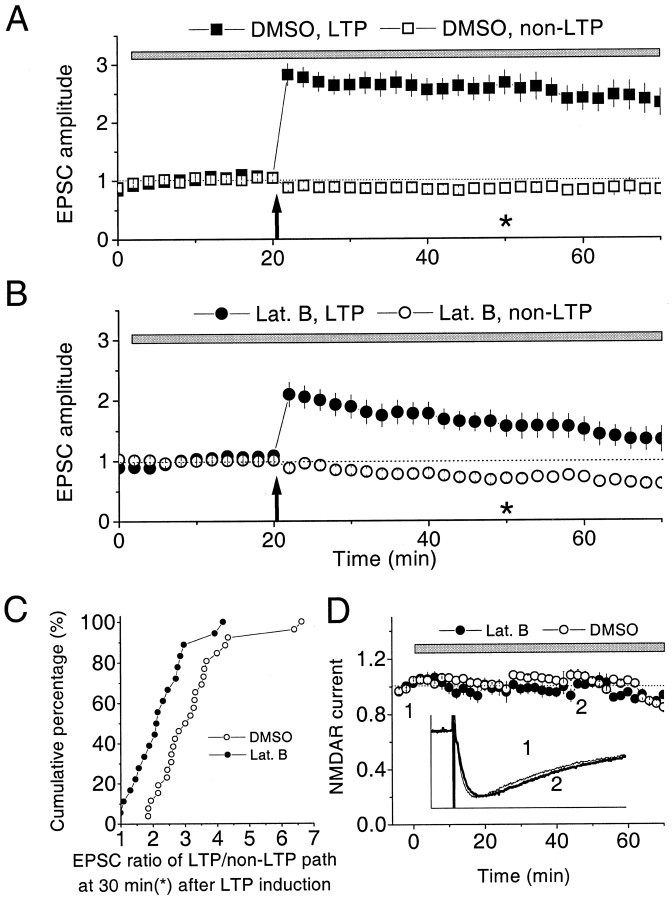
Postsynaptically applied latrunculin B reduces pairing-induced LTP without affecting NMDAR-mediated EPSC. Gray bar indicates the period of internal perfusion of latrunculin B or DMSO through perfusion pipette. Arrow indicates the pairing. A, In control, ≤0.4% DMSO was applied starting 2 min after the initiation of whole-cell recording (n = 26). Eighteen minutes later, LTP was induced by pairing in one pathway (filled rectangles). The initial average potentiation measured at 2 min after induction was 283% of the baseline. The average EPSCs of LTP path and non-LTP path (open rectangles) at 30 min after pairing were 267 and 85%, respectively. B, Postsynaptic latrunculin B reduced pairing-induced LTP. Latrunculin B (100 μm;n = 16; 80 μm; n= 2) in DMSO (total, n = 18) was internally applied 2 min after whole-cell recording, and then pairing was applied 18 min later. The initial average potentiation measured at 2 min after induction was 207% of the baseline (filled circles). The average EPSCs (n = 18) in the LTP path and in the non-LTP path (open circles) at 30 min after pairing were 156 and 69% of the baseline, respectively (those values with 100 μmlatrunculin B were 150 and 68%; those with 80 μm were 194 and 101%). C, Cumulative distribution of the ratio of EPSC in LTP path over that in non-LTP path from individual experiments, measured 30 min (asterisk in A and B) after LTP induction. Open circles are for DMSO control experiments (n = 26), and filled circles are for latrunculin B experiments (n = 18). The shift of distribution by postsynaptic latrunculin B indicates that LTP induction measured at this time is reduced significantly (K–S test; Q ≪ 0.01).D, NMDAR-mediated EPSC was not significantly changed by postsynaptic latrunculin B. The bath solution contained 10 μm CNQX and 1.3 mm Mg2+. Latrunculin B (100 μm; n = 10; 80 μm; n = 5) was internally perfused starting 6 min after whole-cell recording (total, n= 17). The average EPSC (n = 17) at 40 min after latrunculin B application was 96% (that with 100 μm was 97%; that with 80 μm was 94%). As a control, ≤0.2% DMSO internal solution was perfused (n = 23).Inset, Representative average traces of NMDAR EPSC 8 min before (thin line, 1) and after (thick line, 2) 80 μmlatrunculin B application. Calibration: 60 pA, 90 msec.

