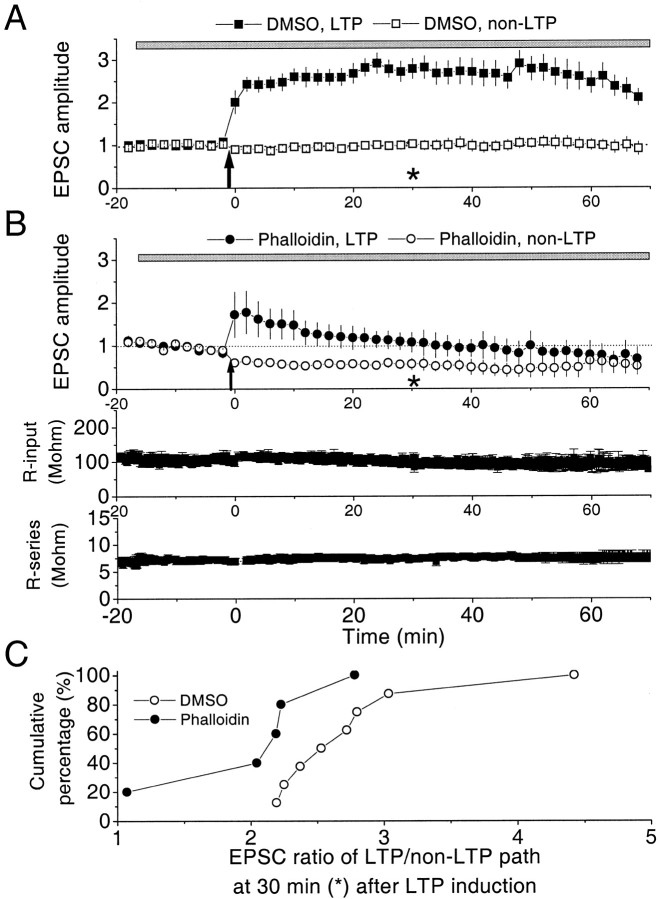
Fig. 8.
Postsynaptically applied phalloidin reduces the LTP induced by pairing. Gray bar indicates the period of internal perfusion of phalloidin or DMSO, and thick arrow indicates pairing. Error bars indicate SEM.A, In controls, 0.1% DMSO was perfused 2 min after the initiation of whole-cell recording (n = 8), and LTP was induced 18 min later. The initial average potentiation measured 4 min after induction was 243% to the baseline (filled rectangles). The average EPSCs in the LTP path and in the non-LTP path (open rectangles) measured at 50 min after induction were 278 and 104% to the baseline, respectively.B, Phalloidin (100 μm) was internally applied 2 min after the initiation of whole-cell recording (n = 7), and LTP was induced by pairing 18 min later. The initial average potentiation measured at 4 min after induction was 178% of the baseline (filled circles). The average EPSCs in the LTP path and in the non-LTP path (open circles) measured at 50 min after induction were 99 and 46% of the baseline, respectively. Bottom traces show the input resistance and the series resistance as a function of time, respectively. C, Cumulative distribution of the ratio of EPSC in the LTP path over that in the non-LTP path at 30 min (asterisks in Band C) after LTP induction. The distribution in phalloidin (filled circles; n= 5) is significantly shifted from that in control DMSO experiment (open circles; n = 8), indicating a significant reduction of LTP at 30 min after induction caused by phalloidin (K–S test; Q ≪ 0.01).

