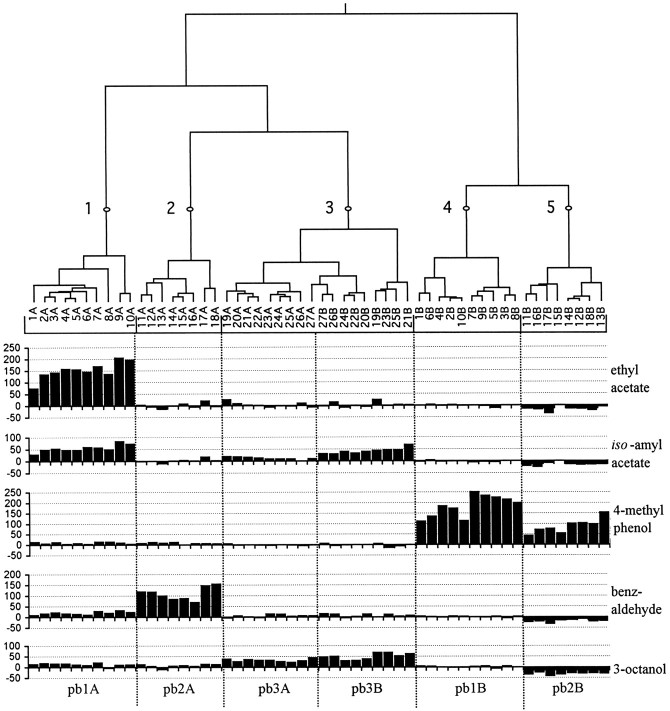
Fig. 7.
Dendrogram of a hierarchical cluster analysis of 54 ORNs in 27 sensilla, comparing their responses to five odors. Branch length is proportional to distance (see Materials and Methods), and five clusters are indicated by the numbered points. Individual ORNs are indicated as the A or B cell of a single sensillum, and their responses, measured as the increase in spikes per second over the spontaneous frequency (y-axis), are shown. Six classes of neurons are indicated at the bottom of the figure. Clusters 1, 2, 4, and 5 correspond to pb1A, pb2A, pb1B, and pb2B, respectively; cluster 3 includes two cell types within the pb3 sensillum, neurons pb3A and pb3B, that can be clearly distinguished by their response to other odors (see Fig. 8) and by differences in spike amplitude (data not shown).

