
Fig. 8.
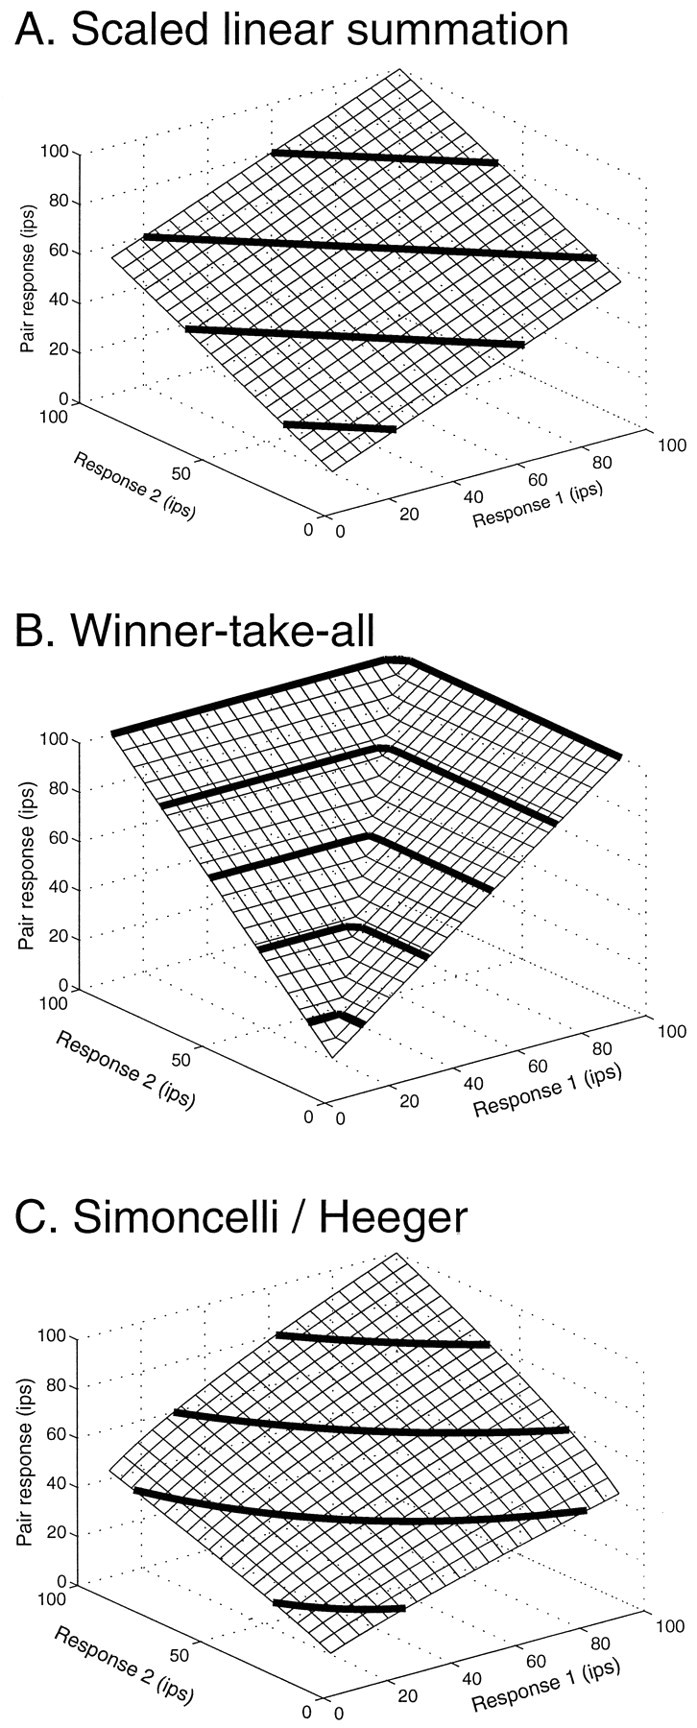
Comparison of predictions of three models for this experiment. A, Linear model: a = 0.5; n = 1. B, Winner-take-all model: a = 1; n = 100.C, Summation followed by squaring: a= 0.0025; n = 0.5. For comparison, the fit values for the two cells portrayed in Figure 6 were Figure6A: a = 0.72;n = 1.36; Figure 6B:a = 0.93; n = 6.68.