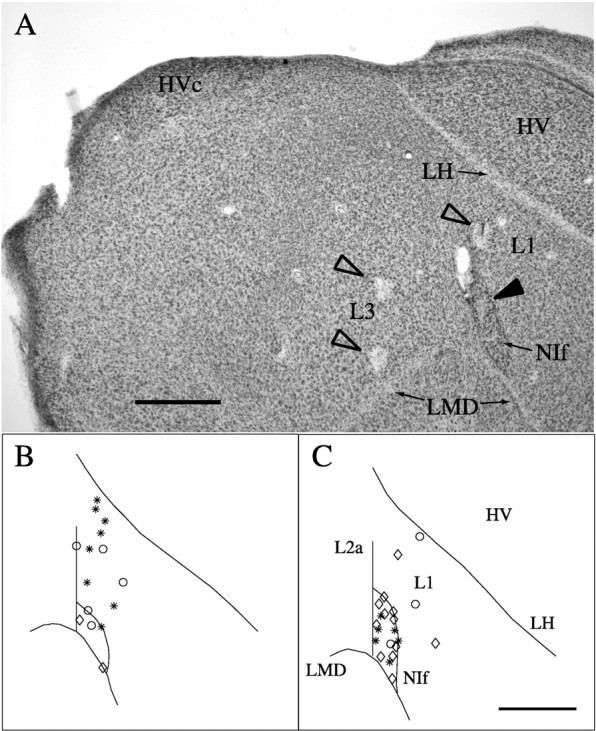
Fig. 1.

Anatomical locations of recording sites.A, Cresyl violet-stained material in a parasagittal section showing sites of electrolytic lesions in L3, L1 (open arrowheads), and NIf (filled arrowhead). NIf is the darkly staining oval nucleus at the bottom right. HVc is at the top left. The lesion in NIf marks the site from which the data illustrated in Figure 2,E and F, were acquired. Scale bar, 500 μm. B, A map of NIf and L1 single-unit recording sites on a standardized schematic of a parasagittal section through the medial aspect of NIf. Asterisks denote recording sites that were either 0–50 μm from a lesion site or along an electrode track with two lesions visible in the same section.Circles denote recording sites along electrode tracks marked with a single lesion and other indication of the orientation of the track, or along electrode tracks without lesions in the same section as a parallel track marked by two lesions. Sites along tracks in sections not possessing lesions, but adjacent to sections with lesions, are marked by diamonds. C, A map of NIf and L1 single-unit recording sites on a standardized schematic of a parasagittal section through the lateral aspect of NIf. Samesymbols as in B. Scale bar (inC): B, C, 500 μm.
