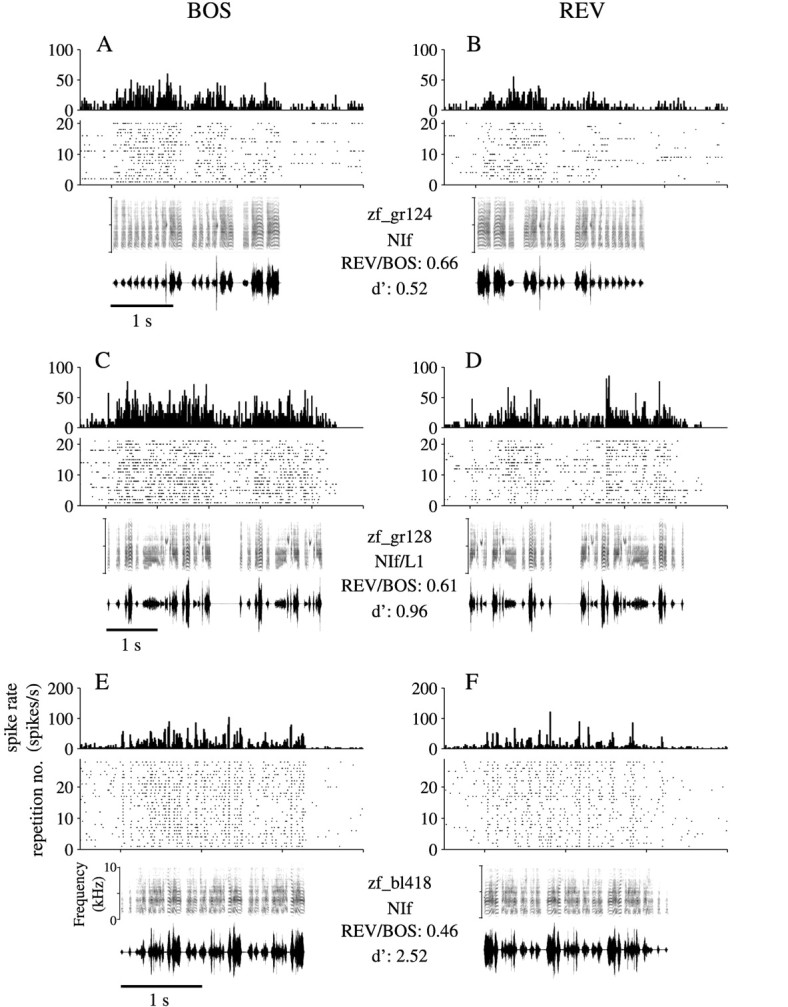
Fig. 2.

Responses of NIf single units to complex auditory stimuli. The activity patterns from three birds of two single NIf neurons and one neuron on the border of NIf and L1 are illustrated in response to playback of the BOS (left column) and REV (right column). For each unit, a PSTH is shownabove a raster plot, which indicates the times of spike occurrences arranged as dots in horizontal rows. The PSTHs and rasters are aligned with the spectrographs and oscillographs shown below the raster. Two values of two song selectivity metrics, the REV/BOS ratio and d′, are indicated below each bird’s name between the BOS and REV columns. The recordings for bird zf_bl418 (E,F) were acquired from the site of the NIf lesion shown in Figure 1.
