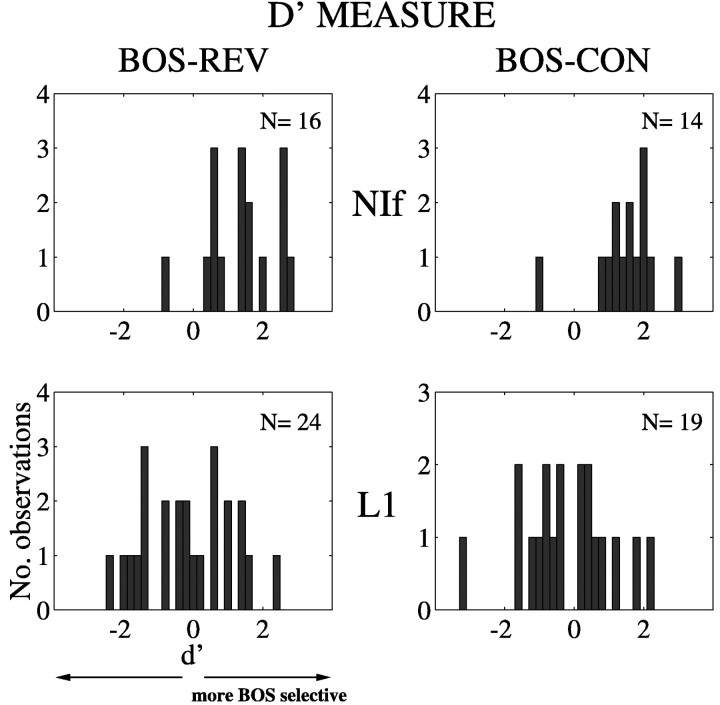
Fig. 4.
Song selectivity of NIf and L1 neurons as measured using an index of discriminability, d′ (see Materials and Methods). The left panels depict comparisons of REV and BOS responses, and the right panels show comparisons of CON and BOS responses. A d′ value of zero indicates no difference between responses to the two stimuli, whereas a positived′ value indicates a stronger response to BOS. The distributions for L1 neurons are centered around zero but are shifted to more positive values for both REV and CON in the case of NIf neurons, indicating selectivity of NIf but not L1 neurons to BOS.

