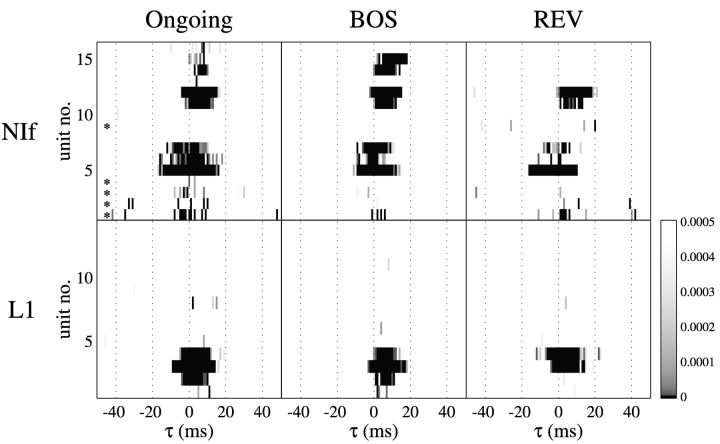
Fig. 7.
Summary of cross-correlations observed between NIf or L1 single units and HVc activity. Each row in apanel corresponds to the cross-correlogram for one unit. Within each row, a vertical bandindicates that the cross-correlation value at that particular τ was significantly greater in the cross-correlogram of the observed activity than in the shuffled activity cross-correlogram (see Materials and Methods). Darker shades of gray indicate a more highly statistically significant result (lower pvalue). The values on the color bar range fromp = 0 to the Bonferroni-corrected significance criterion cutoff value of p = 0.0005. Theasterisks in the top left panel markrows that represent cross-correlograms between NIf single units and HVc single units. For NIf, units numbers 7 and 12 correspond to cross-correlograms shown in Figure 6 for zf_bl411 and zf_bl417, respectively. For L1, units numbers 3 and 4 correspond to zf_bl405 and zf_bl411, respectively.

