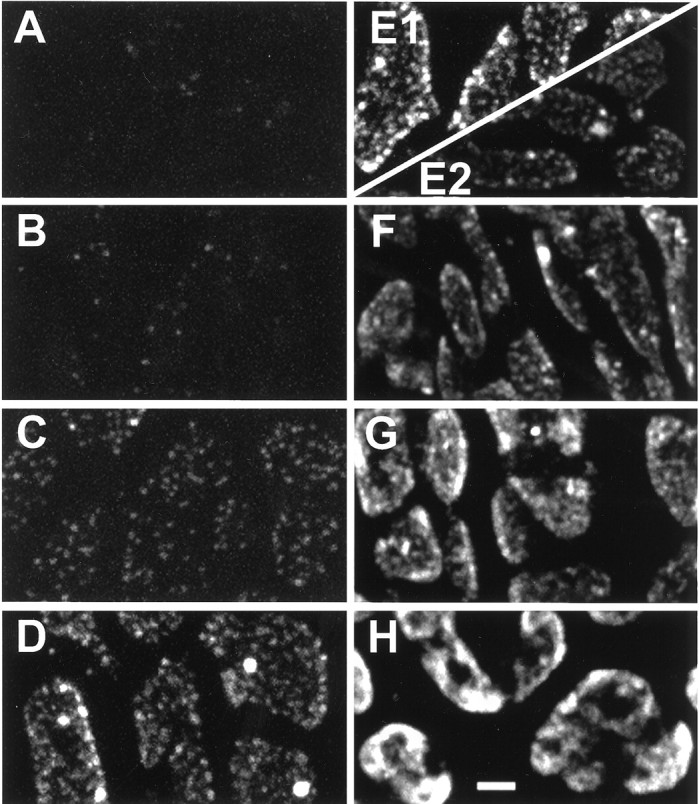
Fig. 2.

SR101-staining patterns resulting from 5 Hz stimulation of various durations. A–E1, From one snake.E2–H, From a different snake. A,Small dots that were first visible after 5 sec.B–E1, Patterns from 10, 20, 40, and 80 sec stimulation, respectively. Note the monotonic increases in brightness and number of dots, plus the appearance of large structures. E2–H, Patterns from 80, 160, 320, and 640 sec stimulation, respectively. Punctate character is obscured as boutons fill with dye. Photomultiplier gain is reduced inE2–H to prevent saturation. Scale bar, 2 μm.
