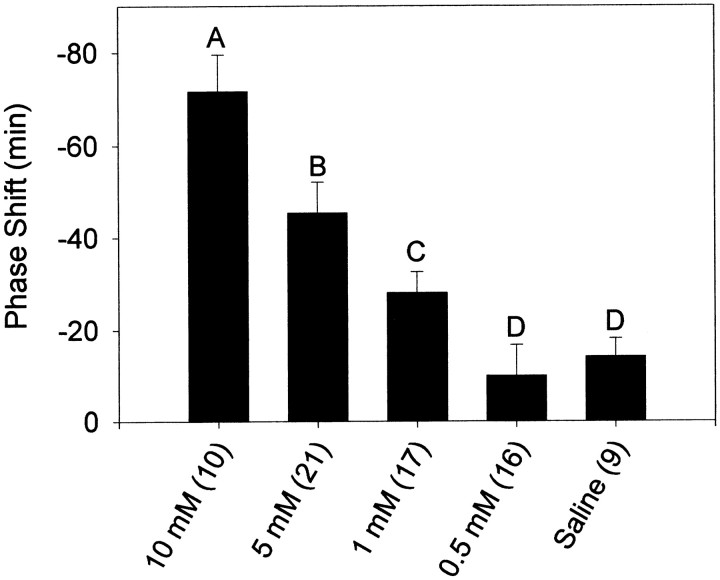
Fig. 2.
Mean ± SEM phase shift in minutes induced by microinjection of NMDA into the SCN region at CT13.5. Sample sizes are denoted in parentheses. Negative values represent phase delays. Letters denote significant differences between groups (p < 0.05) as follows:A, differs from all other groups; B, differs from 10, 5, and 0.5 mm groups; C, differs from 10 mm group; D, differs from 10 and 5 mm groups.

