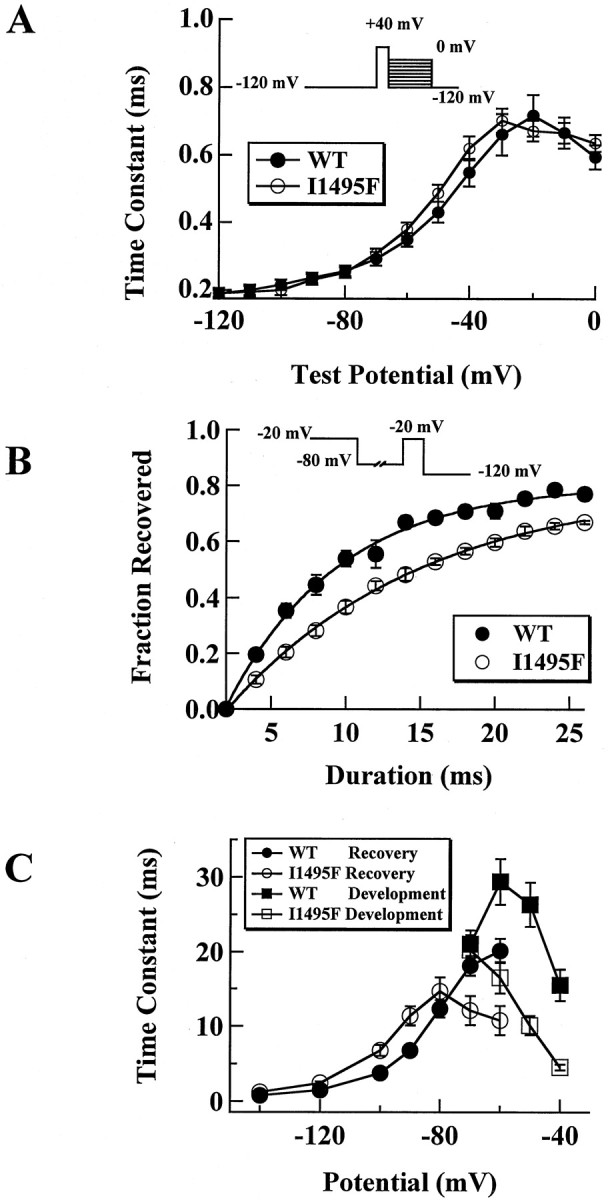
Fig. 5.

Deactivation, development, and recovery from inactivation for I1495F. A, Tail currents were elicited by a 0.5 msec test pulse to 40 mV, followed by repolarization pulses ranging from −120 to 0 mV. Resulting currents were fitted by a single-exponential decay and expressed as function of the voltage for WT (filled circles, n = 20) and for I1495F (open circles, n = 20). B, To assess the rate of recovery from fast inactivation, the following protocol was applied to HEK 293 cells: channels were fast inactivated during 200 msec using 0 mV voltage pulse, then they were allowed to recover at different voltages (−80 mV test pulse is shown as an example) for an increasing time, and finally a 0 mV test pulse was applied to test for the fraction of the channels recovered. Peak currents obtained using the test pulse were normalized to the peak current obtained during the inactivating pulse for WT (filled circles, n = 14) and I1495F (open circles, n = 26).C, Data for development of inactivation (squares) and recovery from fast inactivation (circles) were fitted to a single-exponential function and plotted as a function of the development–recovery pulse voltage. The averaged time constants from WT (filled symbols, n = 10) and I1495F (open symbols, n = 7) are shown.
