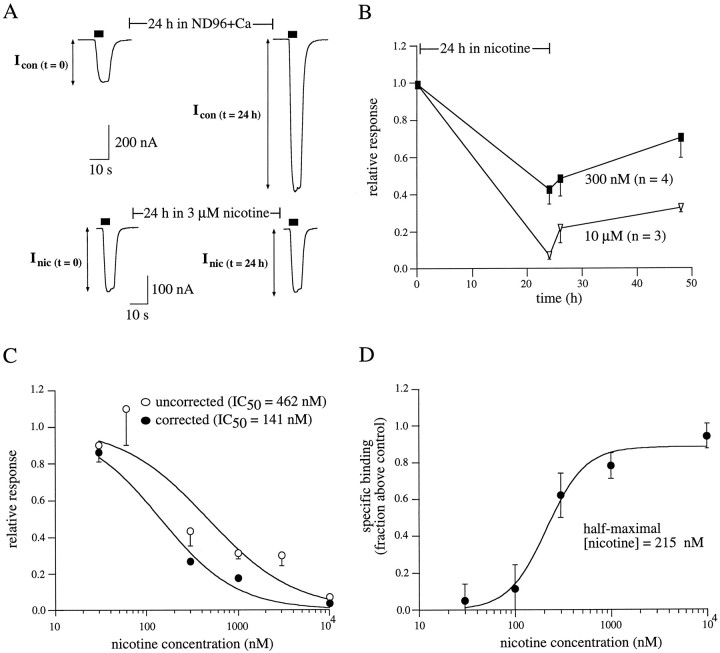
Fig. 4.
Desensitization and upregulation of α3β4 nAChRs. A, Representative traces measured before and after incubation. Experiments are the same as in Figure3A, except that test pulses were performed with 60 μm nicotine and the 24 hr incubation was performed with 3 μm nicotine. B, Representative fractional nicotine-induced responses after 24 hr nicotine incubation. α3β4-expressing oocytes were incubated for 24 hr in control media or media containing 300 nm or 10 μm nicotine. Measurement of peak currents before and after incubation and calculation of desensitization are described in Figure3A. Peak responses were also determined 2 and 24 hr after removal from nicotine. C, Inhibition dose–response curves constructed from fractional responses as described in B. Data are shown both uncorrected (open circles) and corrected (filled circles) for the amount of upregulation (i.e., relative increases in [3H]nicotine binding) observed after 24 hr incubation in nicotine at the same concentration (Fig.3C). The amount of upregulation at a given concentration is taken from the data in Figure 4D. Thesolid lines are logistic fits to mean data from which the half-maximal nicotine concentration for desensitization wasn = 3–15 oocytes per data point. D, Upregulation is nicotine concentration-dependent. [3H]Nicotine binding assays were performed as described in Figure 2B. Data are plotted as the amount of specific [3H]nicotine binding for oocytes incubated in nicotine compared with the specific [3H]nicotine binding for control oocytes not incubated in nicotine (n = 4–9 oocytes per data point).

