
Fig. 3.
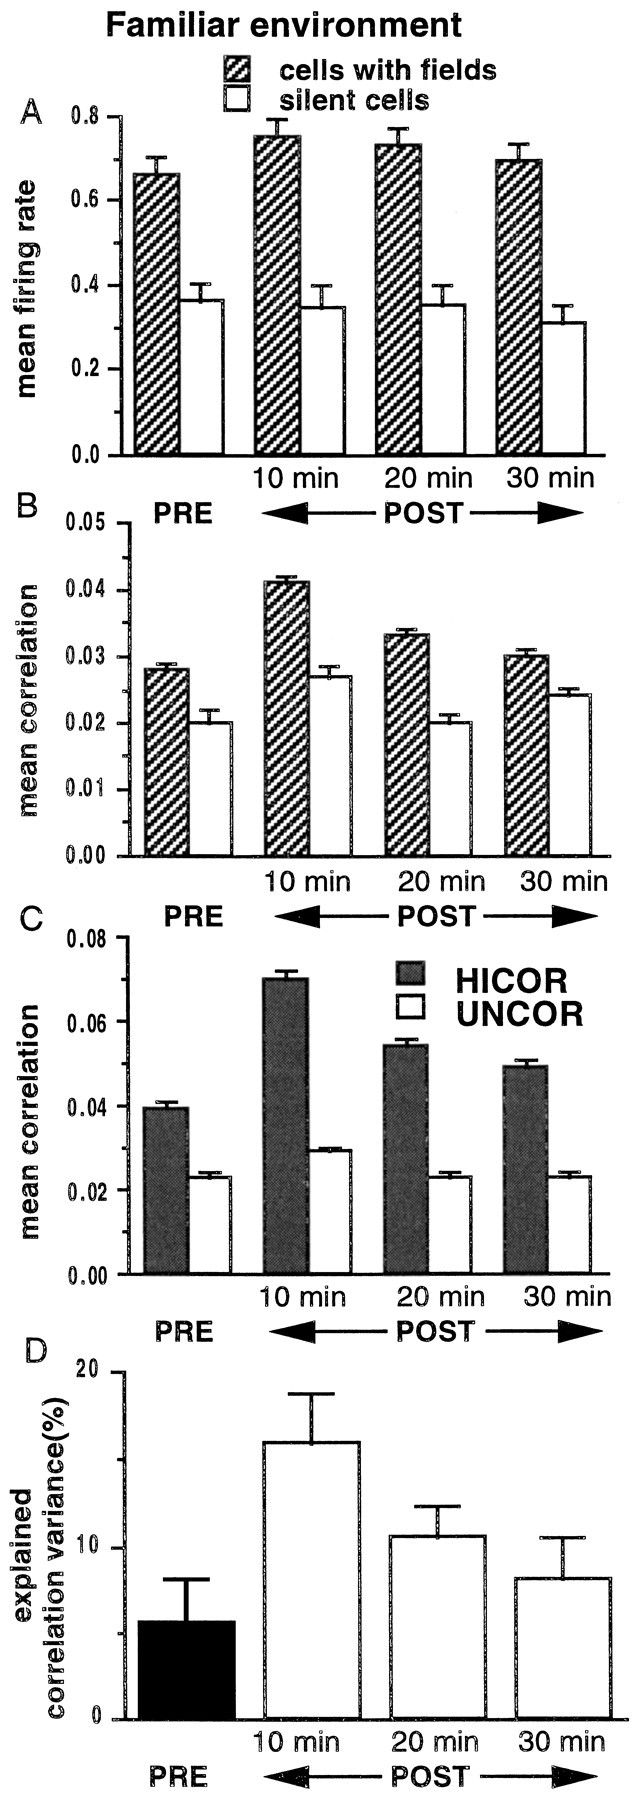
A, Histograms of the mean firing rates of pyramidal neurons during pre-behavior SWS (PRE) and three 10 min intervals in post-behavior SWS (POST), computed by averaging across 22 track-running sessions from seven rats, are shown. The firing rates of cells with place fields on the track (n = 423) increased marginally (p > 0.05, ANOVA) and returned rapidly toward their PRE levels with a time constant of 20 min. For all periods, the firing rates of cells with fields on the track were significantly higher than were the firing rates of cells inactive during track running (n = 237;p < 0.05, ANOVA). B, Mean correlations of cell pairs (using 100 msec bins) during the same time periods described in A are shown. The mean correlation of cells active on the track increased from PRE to POST (p < 0.05), but the increase rapidly declined over the 30 min period (τ = 12 min). The mean correlations of cells inactive on the track did not change significantly (p > 0.05, ANOVA). C, In the cell group with fields on the track, correlation values were sorted into HICOR (correlation ≥ 0.01) and UNCOR (correlation < 0.01) sets. The mean correlation of the HICOR set was significantly higher compared with the mean correlation of the UNCOR set (p < 0.05, ANOVA). This difference, present in 6 of 22 sessions in PRE, was enhanced in all 22 sessions during POST (significant interaction on a repeated-measure ANOVA) as the mean correlation of the HICOR set (mean correlation of 0.10 ± 0.003 on track) increased from a PRE value of 0.04 ± 0.002 to a POST value of 0.07 ± 0.002 (p < 0.05, ANOVA). This increase decayed rapidly (τ = 18 min). The mean correlation of the UNCOR set (mean correlation of −0.02 ± 0.000 on track) increased from a PRE value of 0.02 ± 0.001 to 0.03 ± 0.000 in POST (p > 0.05, ANOVA). It is theoretically possible that the differences in the mean correlations between the two groups in the histogram could be attributable to differences in the firing rates of the neurons in the two groups; however, the majority of cells were members of pairs in both groups, and there were no significant differences in the mean firing rates between the HICOR and UNCOR cells during POST (19 of 22 sessions;p > 0.05). D, Explained correlation variance (EV) during the same time periods described inA are shown. For PRE, EV was computed using the square of the simple correlation coefficientrRUN–PRE (solid bar onleft). For POST, EV was computed using the square of the partial correlation coefficientrRUN–POST‖PRE (3 bars onright). The EV for all periods of SWS was significantly >0 (p < 0.001, ANOVA) and increased significantly after behavior (p < 0.05, ANOVA). The decay time constant (baseline = 0) was 30 min, suggesting that the similarity of the correlation matrices for the RUN and POST periods outlasts changes in the average magnitude per se. Note that the baseline for the POST EV is 0, not the PRE value, which is removed by the partial correlation procedure (see Materials and Methods).