
Fig. 2.
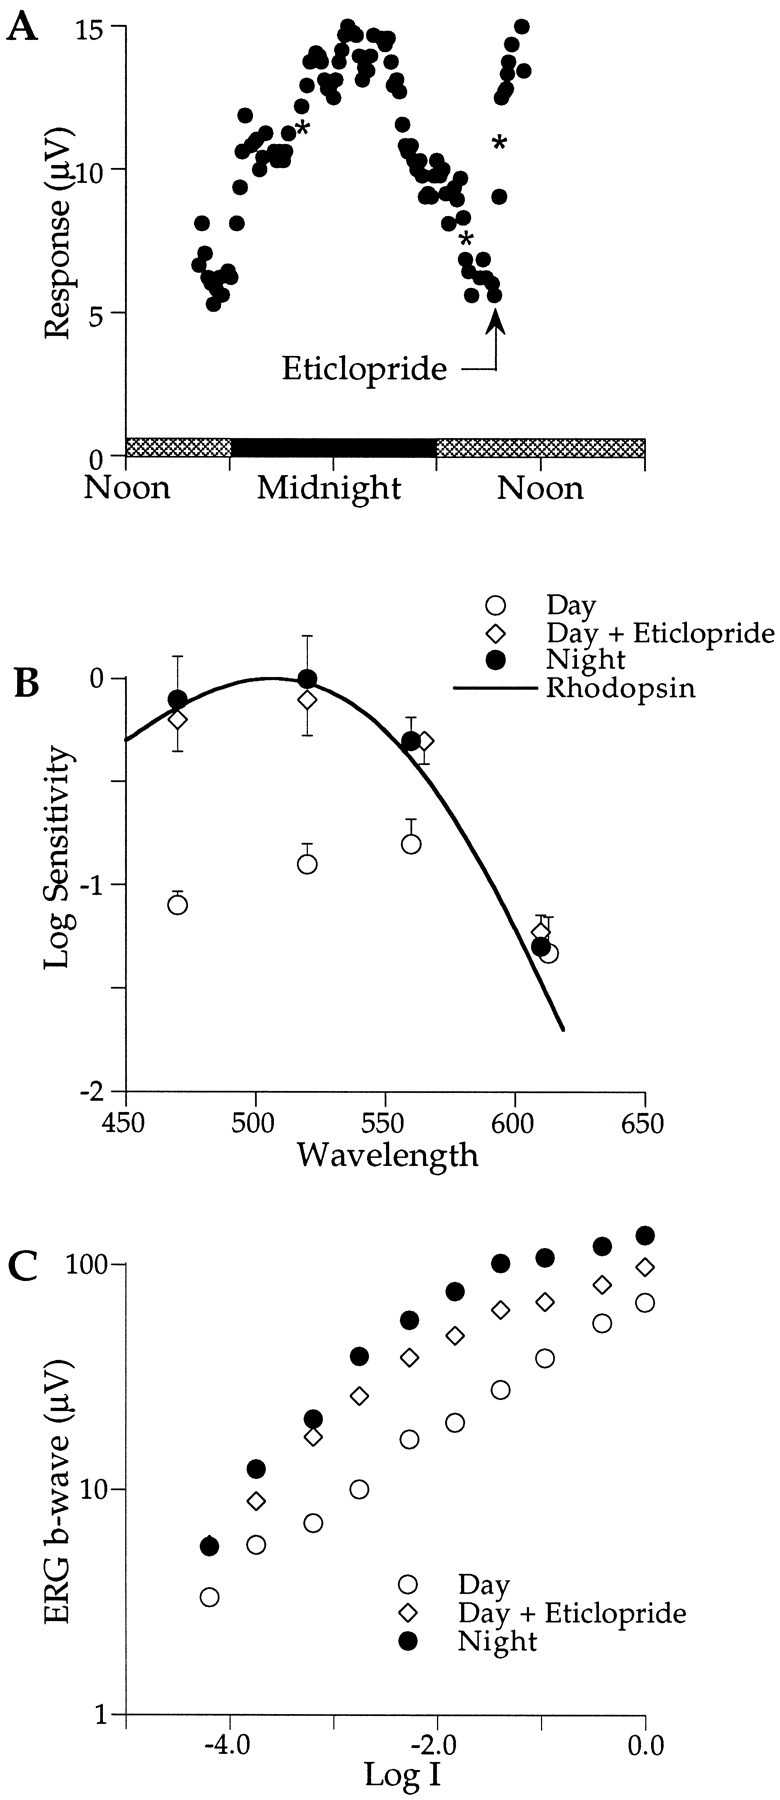
A, The amplitude of the ERG b-wave in response to 470 nm flashes is plotted as a function of time of day as described in Figure 1. The amplitude is low (∼5 μV) during the end of the first subjective day (cross-hatched horizontal bars), increases during the subjective night (filled horizontal bars), and decreases near the subjective dawn, reaching a low value (∼5 μV) by 0800 hr. Eticlopride, injected at 0935 hr (arrow), rapidly increased the b-wave amplitude to nighttime levels.Asterisks denote the time of spectral sensitivity measurements. B, Eticlopride, injected during the day, shifts the retina from cone dominance (open circles; λmax = ∼560 nm) to rod dominance (open diamonds; λmax = ∼500 nm) that matches the spectral sensitivity of the nighttime data (filled circles; λmax = ∼500 nm). Sensitivity does not change at the isosbestic point of 610 nm. The solid curve plots the rod nomogram for λmax = 506 nm. The criterion response was 10 μV (n = 3). Error bars indicate SEM. C, Intensity–response functions of the b-wave measured in constant darkness in response to 470 nm flashes are shown. The intensity–response function grows monotonically with increasing stimulus intensity at night (filled circles) but exhibits a characteristic plateau region at intermediate stim ulus intensities during the day (open circles). Eticlopride injection during the day abolishes the plateau, yielding a function that approximates that measured at night (open diamonds). At Log I = 0.0, each 50 msec flash delivered 5 × 10¹² photons cm−2 at the cornea.