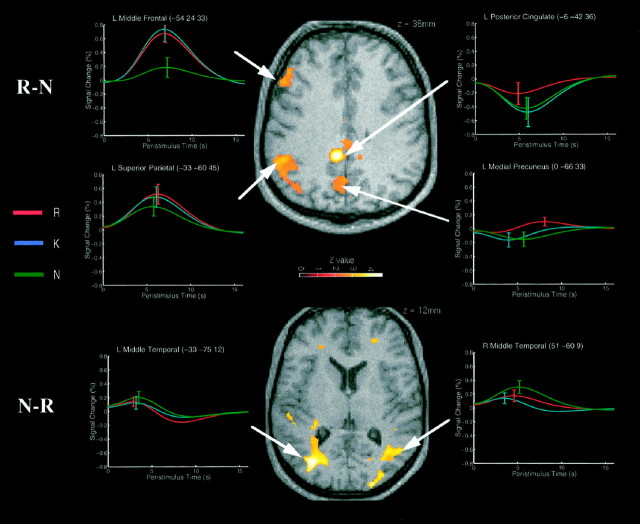
Fig. 1.
Regions showing enhanced event-related responses to correct R versus correct N judgments (top panel) and correct N versus correct R judgments (bottom panel). The anatomical slices are taken through a normalized T1 structural image of one participant’s brain. The activations reflect t tests on the height of the best-fitting canonical hemodynamic response function (HRF) across participants, thresholded at p < 0.01 for the purpose of illustration. The event-related plots are the sum of the best-fitting canonical HRF and its derivative (see Materials and Methods) from the voxel in the maxima of the activations, for the nine participants who made sufficient numbers of correct R, K, and N judgments. The error bars show the SE of the mean fitted HRF height across the nine participants (not the SE of the mean difference in fitted HRF heights for R and N judgments, which forms the error term in the repeated-measures t tests).

