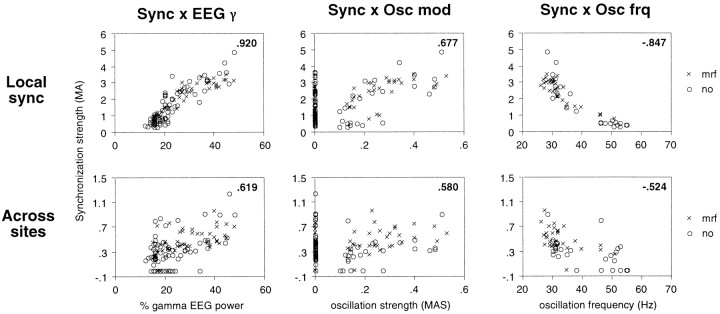
Fig. 15.
Relationship between local synchronization (top row) or synchronization across sites (bottom row) and γ power of the EEG (Sync ×EEG γ, left column), oscillatory modulation (Sync × Osc mod,center column), and oscillation frequency (Sync × Osc frq, right column). Two sites were recorded from A17 of the same hemisphere; the strength of local synchronization is depicted for only one of the two sites. Ordinates, Strength of synchronization (MA). Abscissas, fromleft to right, Relative γ power of the EEG, strength of oscillatory modulation (MAS), and oscillation frequency (hertz) at the site depicted in the top row. Examples of correlograms from the two sites are displayed in Figure 16.Circles, No MRF; crosses, during MRF stimulation. Insets, Spearman correlation coefficients;p < 0.01.

