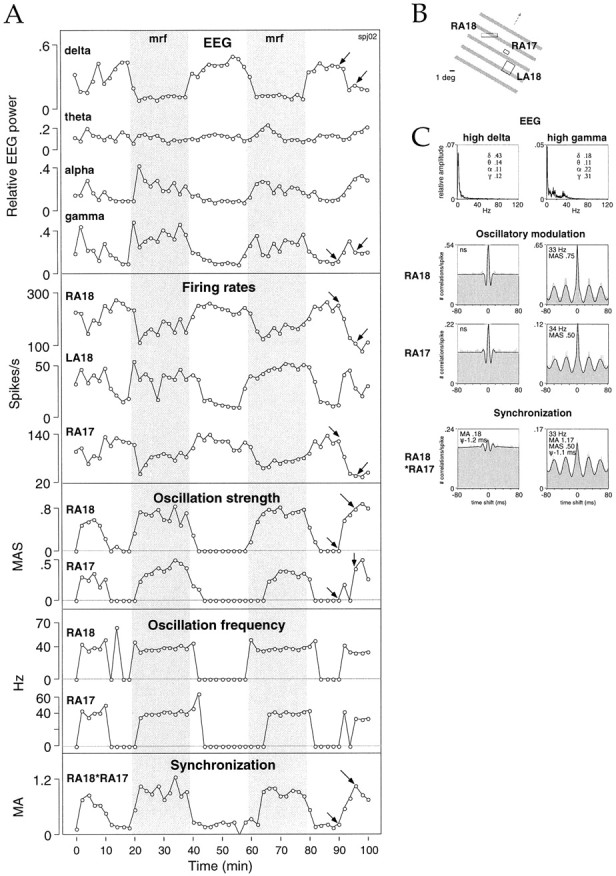
Fig. 5.

Synchronous oscillatory modulation of visual responses appears and disappears simultaneously in areas 17 and 18 concurrently with changes in the level of cortical activation occurring spontaneously or in response to MRF stimulation. A, Comparison of the time course of changes in EEG power (top box) with response variables (bottom boxes) at three recording sites in left area 18 (LA18), right area 18 (RA18), and right area 17 (RA17): firing rates, oscillation strength, oscillation frequency, and synchronization between RA18 and RA17. As the EEG becomes dominated by activity in the γ frequency range, firing rates increase at recording site LA18 and decrease at recording sites RA18 and RA17; responses at these two sites then begin to exhibit oscillatory modulation in the γ frequency range, and their synchronization becomes stronger. Shaded bars, Periods when MRF stimulation precedes each presentation of the visual stimulus.B, Receptive fields of the recording sites and visual stimulus. C, From top tobottom, averaged power spectra and auto- and cross-correlation functions for sites RA18 and RA17 measured at the times indicated by the arrows in A(duration of analysis window, 4 sec).
