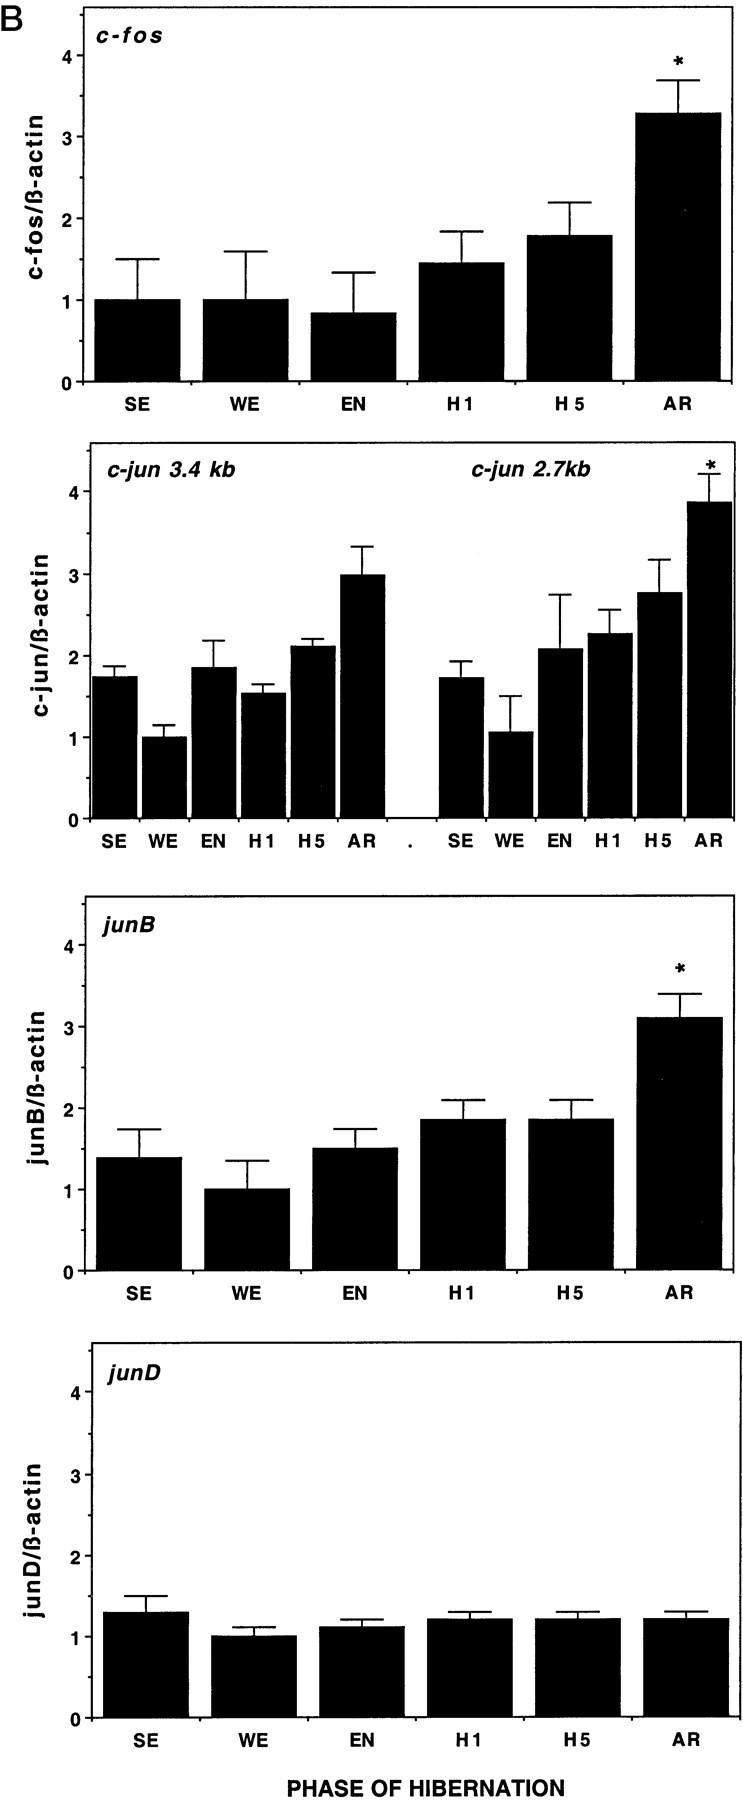
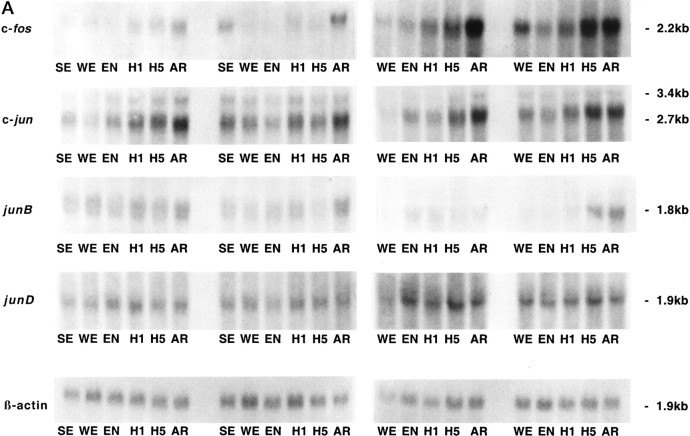
Fig. 3.

Expression of IEGs in hypothalamus across hibernation. A, Autoradiographs of Northern blots of total RNA (20 μg/lane) isolated from hypothalamus of ground squirrels killed during different phases of the hibernation cycle and hybridized to [32P]-labeled c-fos, c-jun, junB, and junD cDNA probes. Sizes of mRNAs are shown to the right in kilobases. Note the increasing levels of both c-fos and c-jun mRNA during late torpor and then peaking during arousal relative to other phases of hibernation. The c-fos probing on the left and rightwere done at different times with different specific activity and total counts per minutes and do not represent differences in c-fos expression between these groups. Each blot was normalized internally for statistical analyses shown in the histograms in B.SE, Summer euthermic; WE, winter euthermic; EN, entrance; H1, hibernation day 1; H5, hibernation day 5; AR, arousal. β-actin mRNA serves as a control for RNA loading in each lane. n = 4 for each condition during the hibernation season, and n = 2 for summer euthermia (SE). B, Quantitation of the relative mRNA levels are shown based on band density of the autoradiograms inA. Each graph displays means ± SEs. To control for variability in loading and transfer, all data are presented relative to β-actin, whose expression remains constant throughout the hibernation cycle relative to total RNA and total mRNA (data not shown). mRNA levels of c-fos, c-jun, and junB during arousal (AR) are significantly elevated relative to baseline winter euthermic levels. *p < 0.01.

