
Fig. 4.
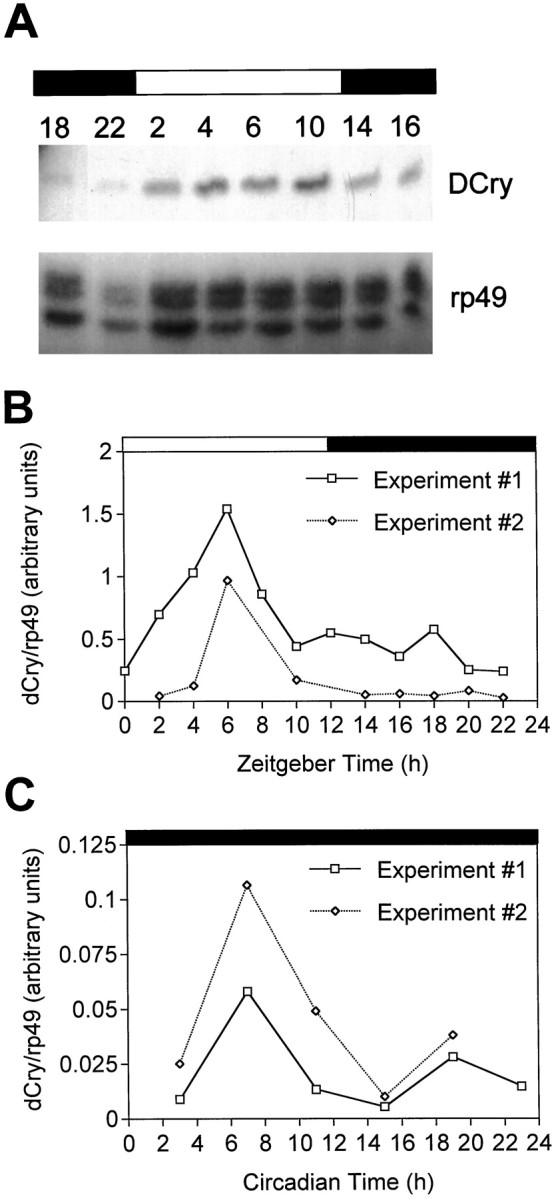
The DCry mRNA oscillates in abundance in head tissues during the diurnal cycle. A, RNase protection gel showing the relative abundances ofDCry (above) and rp49(below) RNAs at different times of the day.Numbers above the gel indicate zeitgeber time (ZT, in hours). B, Quantitation of DCry RNA abundance relative to rp49 abundance in two independent LD experiments. The open and filled rectangles above A and B show the light and dark portions of the LD 12/12 cycle to which adults were entrained.Numbers refer to zeitgeber time (ZT). Similar results were obtained in two other experiments. C, Quantitation of DCry RNA abundance in constant darkness (DD).Numbers refer to circadian time (CT). Data are shown for two independent experiments. In two other DD experiments not shown here, similar circadian changes in RNA abundance were documented, although peak RNA abundance was several hours earlier than that shown in C. In those experiments RNA abundance changed by approximately four- to fivefold during the circadian cycle.