
Fig. 5.
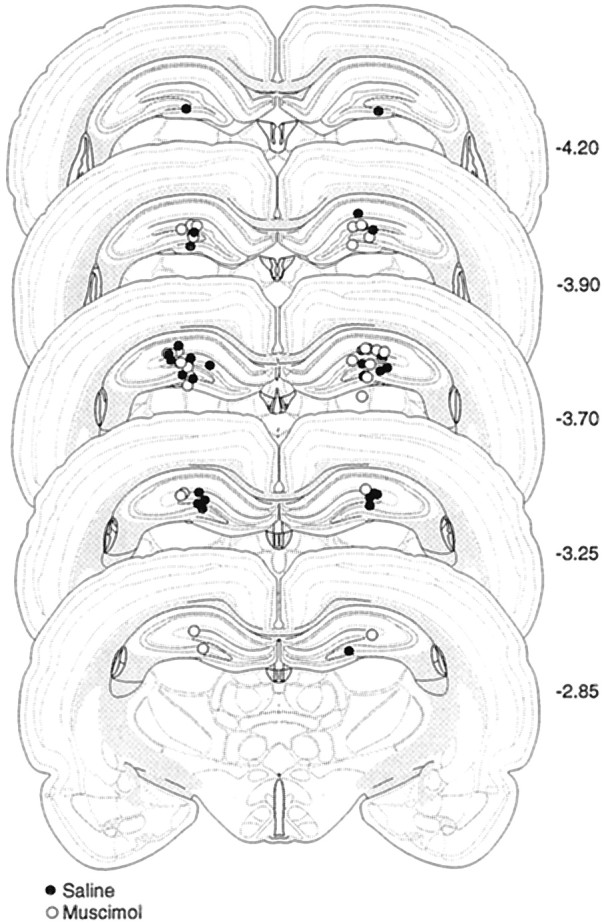
Schematic illustration of cannula placements in the dorsal hippocampus (Experiment 3). Schematic representation of injecting cannula tip placements in the dorsal hippocampus for all rats included in the Experiment 3 analysis. Values to theright of the coronal sections indicate the position of each section relative to bregma (millimeters caudal to bregma). Coronal brain section images are adapted from Swanson (1992).