
Fig. 6.
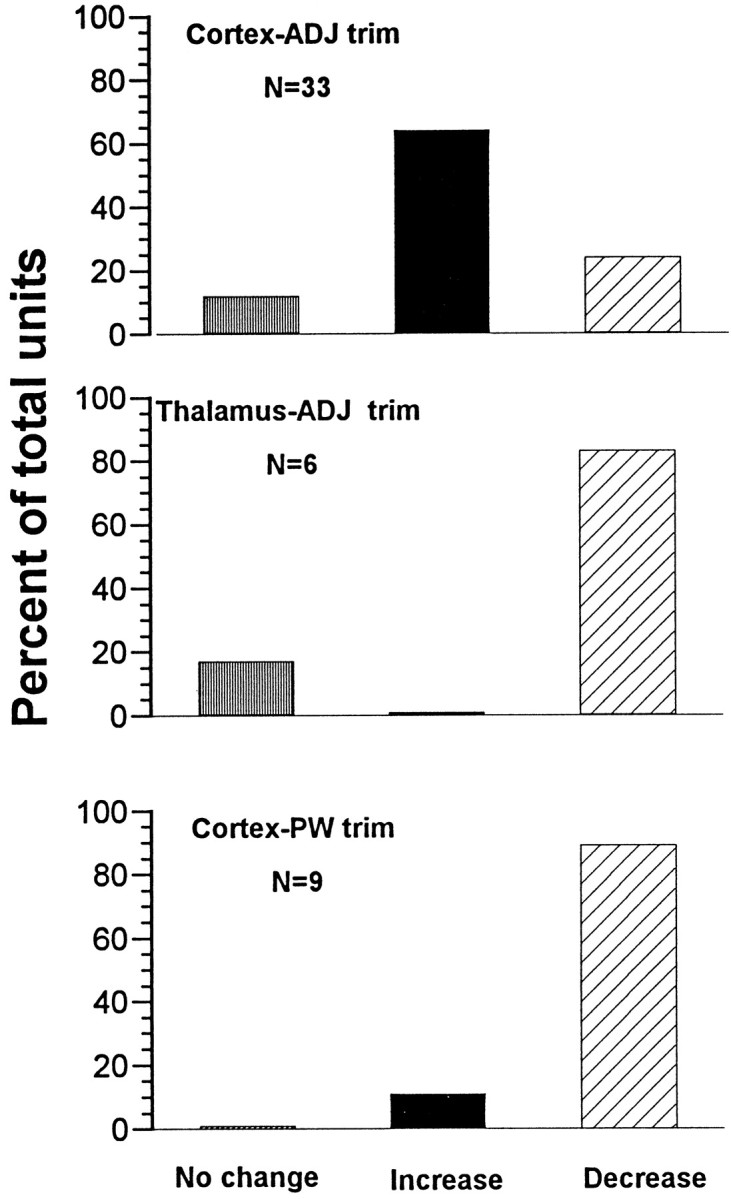
Summary of statistical comparisons performed on individual units. Student’s t tests were used to compare pre-trim and post-trim spike activity (100 msec epochs) for all units in the three experimental conditions. Shown are percentages of each population showing statistically significant changes (p < 0.05; two-tailed).