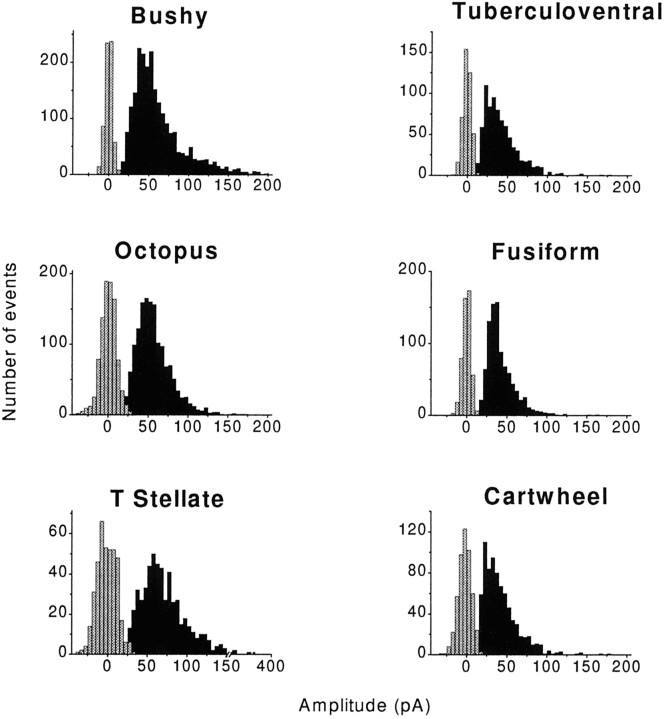
Fig. 3.
Amplitudes of events are variable in all cell types. The majority of mEPSCs was distinguishable from the noise (gray bars). Amplitudes varied widely within each of the cell types, on average being largest in T-stellate cells and smallest in cartwheel cells. The data are binned at 10 pA; each histogram represents data pooled from several cells of each cell type. The data are summarized numerically in Table 1.

