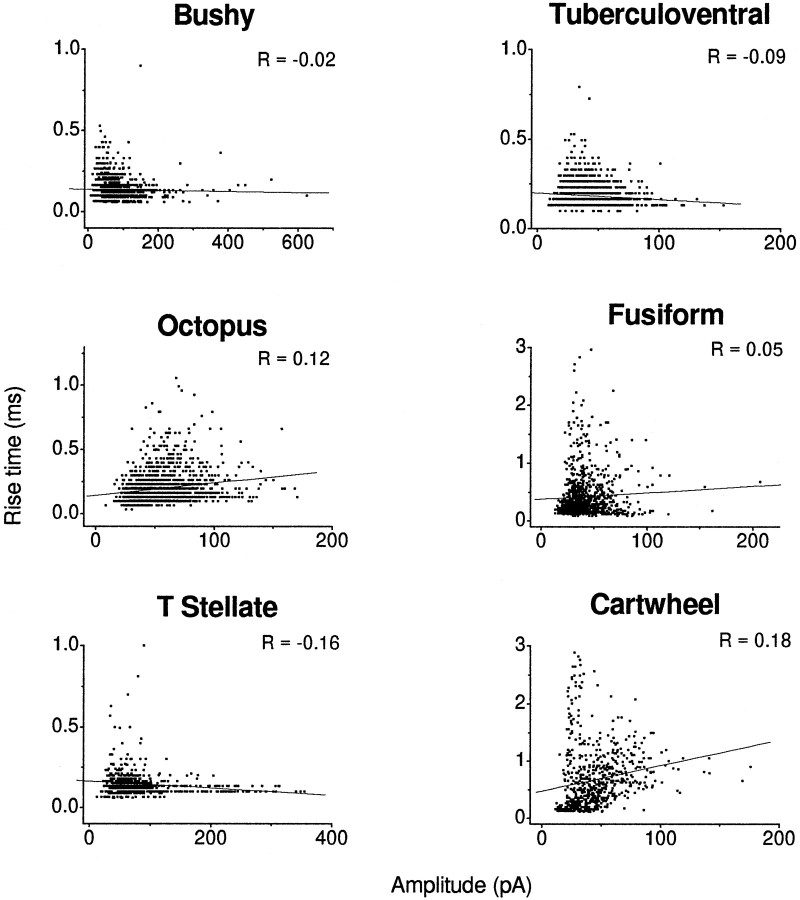
Fig. 6.
Plots of rise times against amplitudes show no evidence for dendritic filtering. Plots of rise times as a function of amplitude had positive or slightly negative correlations. For each scatterplot a simple regression line was fit through the data, and the correlation coefficient was computed. Negative correlations between rise time and amplitude are indicative of filtering; an absence of correlation can be the result of the large variability in amplitude that commonly is observed in these cells. The data represent values pooled from several cells of each cell type.

