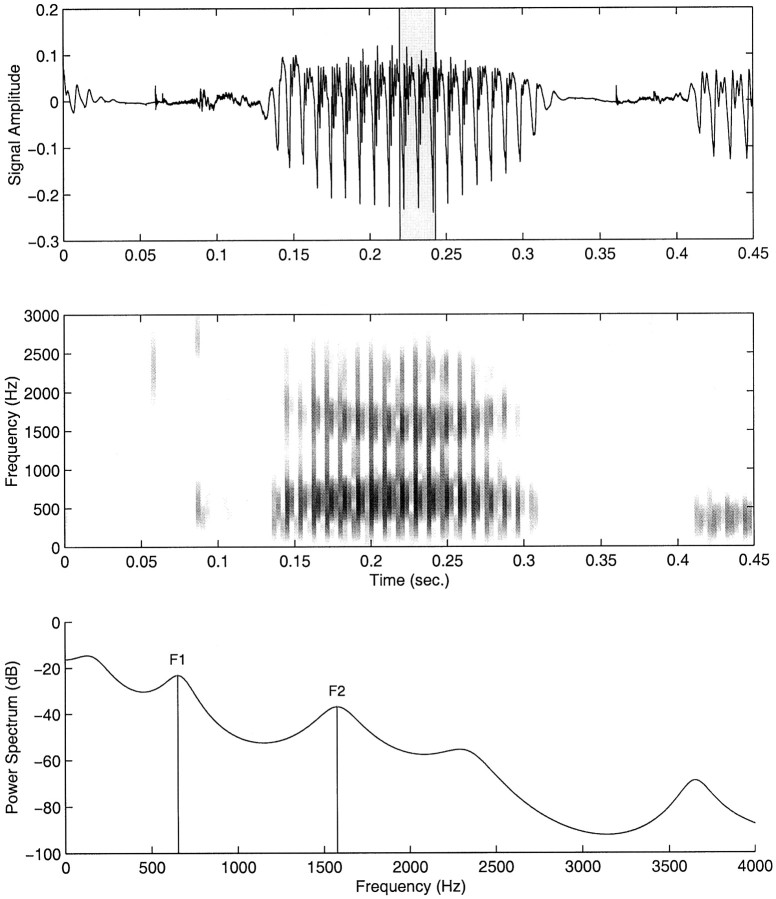
Fig. 2.
Scoring procedure for acoustical data. Top panel, Acoustic signal during the CVC. A 20 msec analysis window (shown in gray) is selected during the steady-state portion of the vowel, located on the basis of a frequency spectrogram (middle panel). F1 and F2 frequencies are determined from an estimate of the power spectral density computed across the analysis window (bottom panel).

