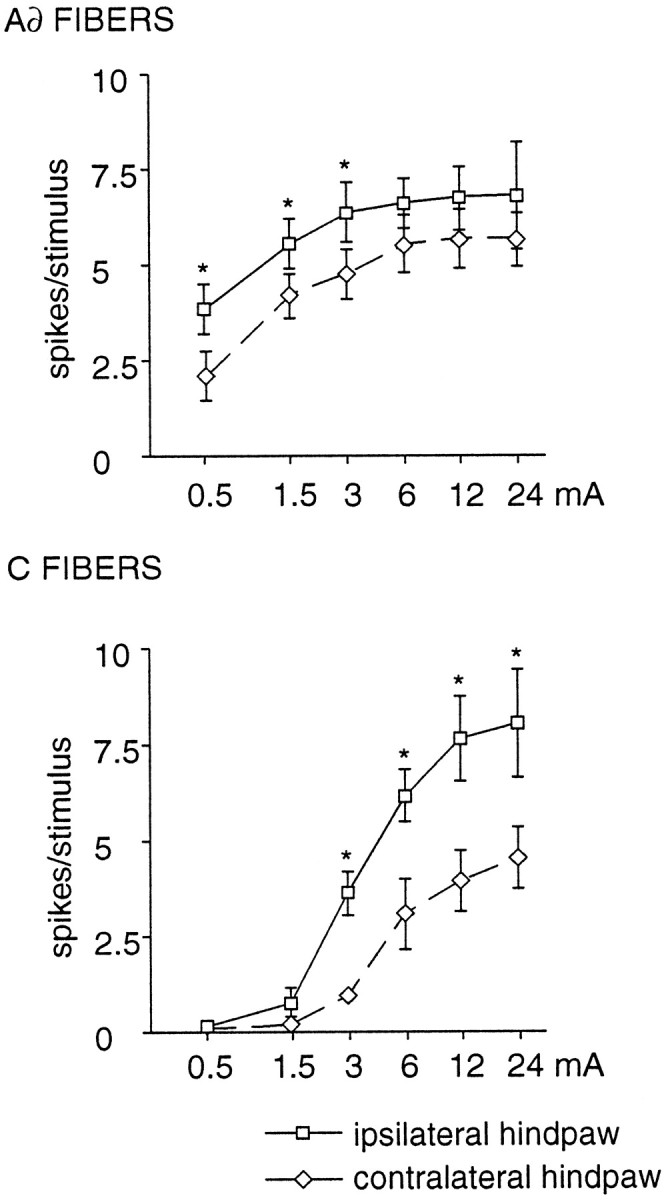
Fig. 4.

Mean magnitudes of Aδ- and C-fiber-evoked responses from VMl neurons (n = 10) after percutaneous electrical stimulation of the hindpaws at different intensities. The stimulus–response relationships are represented as semilogarithmic plots (ordinate, magnitude of the responses; abscissa, stimulus current intensity). Note the linear relationship between the log of the intensity of the applied current and the magnitude of the Aδ- and C-fiber responses in the 0.13–3.0 and 0.5–12 mA ranges, respectively, for the ipsilateral and contralateral hindpaws (y = 1.8 logx + 1.5;p < 0.0001; r8 = 0.66; y = 0.6 logx + 1.2;r8= 0.68; p < 0.0001 for the ipsilateral hindpaws; and y = 1.5 logx + 0.8; r8 = 0.69;p < 0.0001; y = 0.3 logx + 0.8; r8 = 0.63;p < 0.0001 for the contralateral hindpaws). Note also that the responses of the VMl neurons were significantly larger after stimulation of the ipsilateral hindpaw (*p < 0.05, corrected by Bonferroni procedure).
