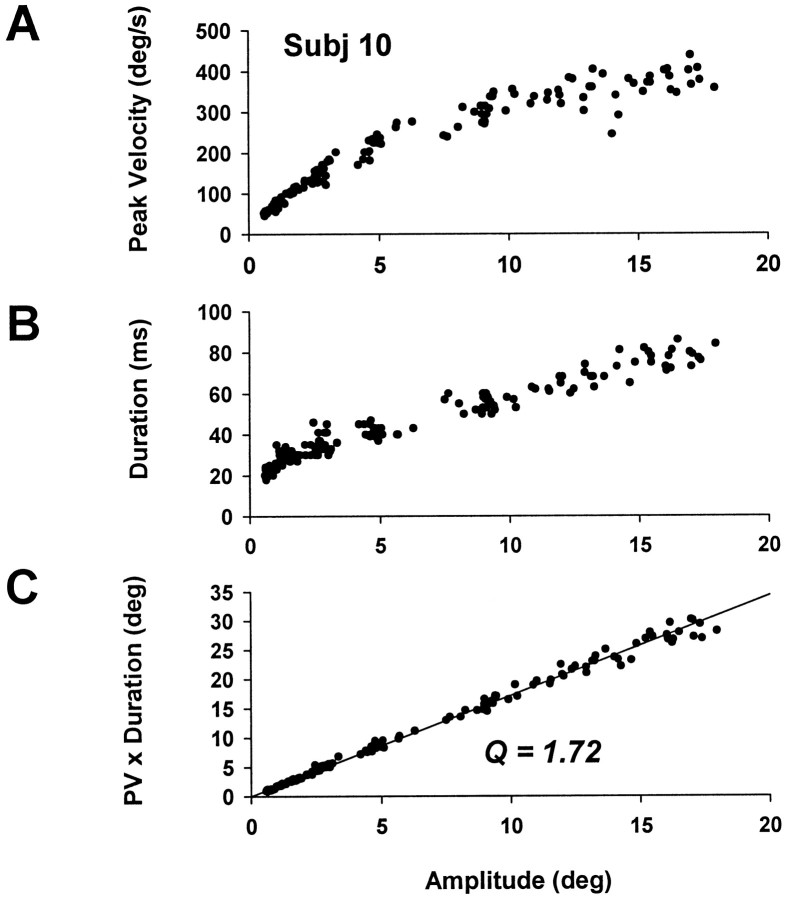
Fig. 6.
Time-domain analysis of saccades showing typical temporal main sequence relationships. A, Peak velocity versus amplitude. B, Duration versus amplitude.C, Peak velocity × duration versus amplitude. Regression line constrained through origin gives the ratio of peak velocity to mean velocity, Q.

