
Fig. 6.
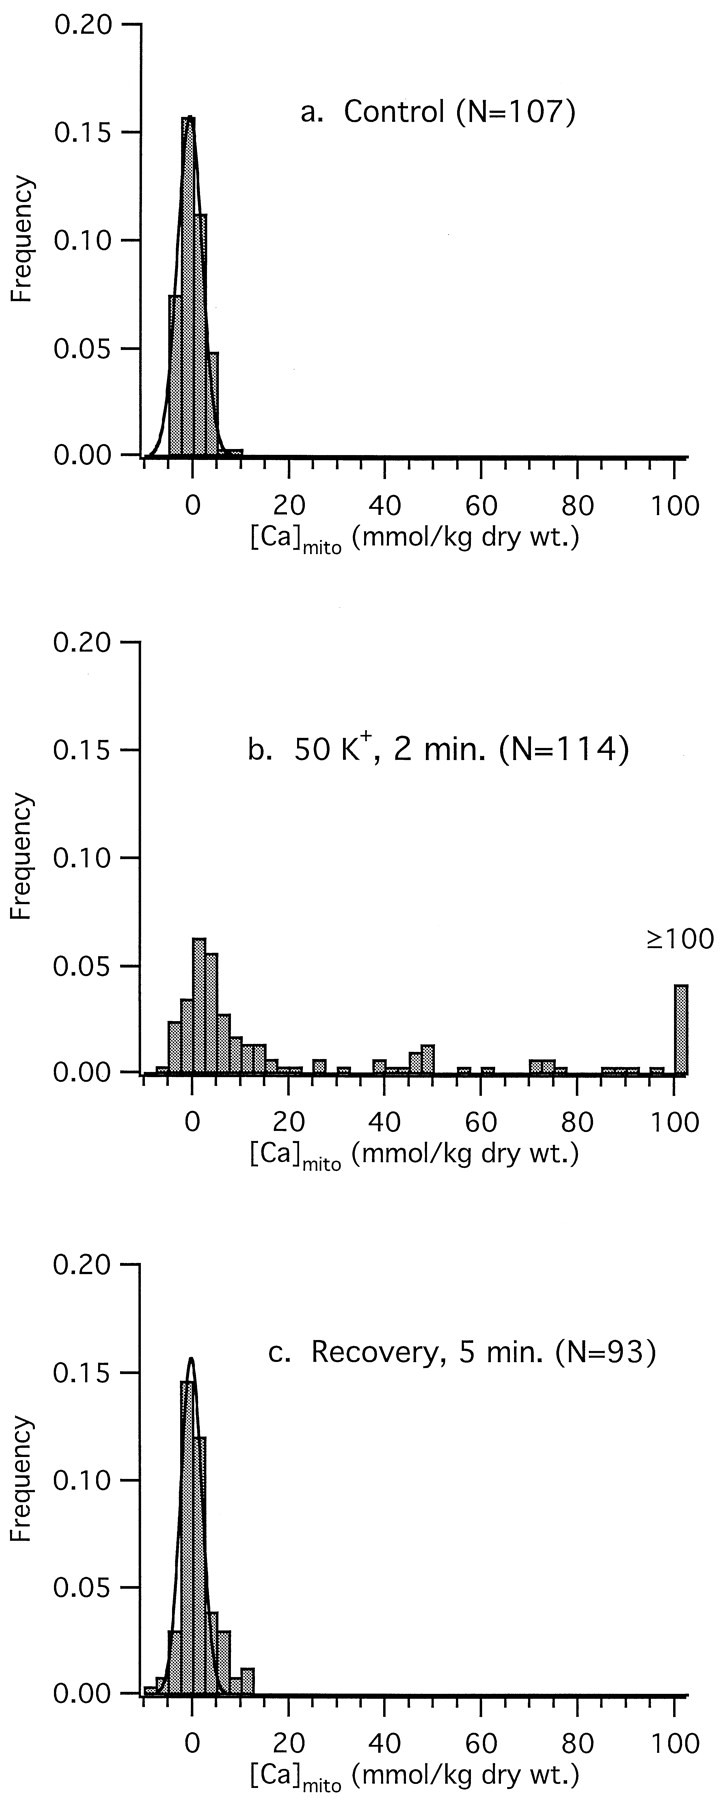
Frequency distributions of [Ca]mitoreveal intermitochondrial heterogeneity during depolarization.a, [Ca]mito in resting neurons is low and normally distributed with no detectable differences between cells or between individual mitochondria within a given cell. Smooth curve represents fitted Gaussian with mean and SD −0.6 and 3.6 mmol/kg dry weight, respectively. b, Collected results from 114 mitochondria from 12 cells illustrating the distribution of [Ca]mito after a 2 min, 50 K+depolarization. All 12 cells tested responded in a qualitatively similar manner. The skewed distribution of mitochondrial responses persists into the recovery phase, as revealed by a continued nonuniform distribution of [Ca]mito at 2 min after repolarization (data not shown). c, At 5 min after repolarization, the [Ca]mito distribution is indistinguishable from that observed in control neurons. Mean and SD for fitted Gaussian are −0.14 and 3.1 mmol/kg dry weight.