
Fig. 1.
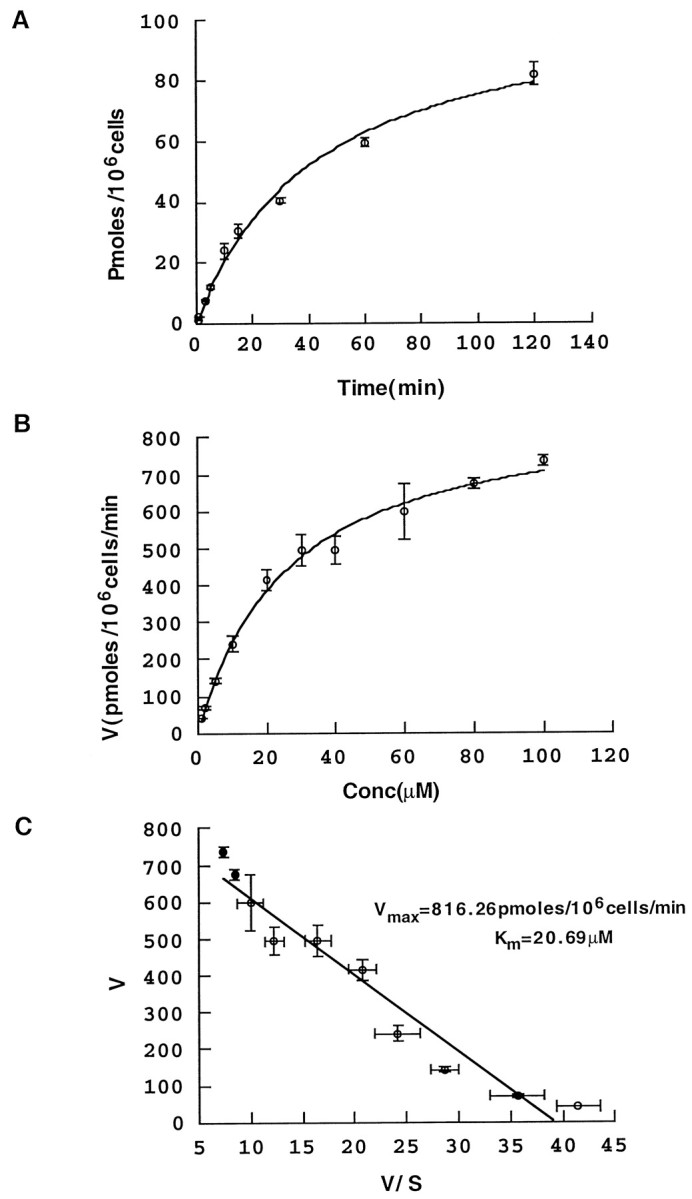
Characterization of proline transport.A, Time course of transport. HEK-293 cells stably transfected with rat PROT cDNA reveal time-dependent PRO uptake. Proline transport was assayed, as described in Materials and Methods, for increasing time periods, and the picomoles of accumulated PRO were plotted against the incubation time. The data pointsrepresent the means ± SEM (2 or 3 batches of cells; 6 experimental values for each point). B, Concentration dependence of transport. Proline uptake was measured, over a concentration range from 1 to 100 μm, during a 20 min incubation time in KRHT buffer at 37°C. We kept the concentration of radiolabeled PRO (50 nm) constant and adjusted the total concentration to desired values by adding appropriate concentrations of unlabeled PRO. The high-affinity component of PRO uptake was calculated by subtracting the uptake values obtained in the presence of 100 μm GGFL from total uptake measured in the absence of GGFL. We have plotted the PRO uptake rate versus PRO concentration. Thedata points represent the means ± SEM as inA. The data were analyzed first by nonlinear curve fitting, with the Hill coefficient as a free parameter. After determining that the coefficient was close to one, we set it exactly to one and determined Vmax andKm. Proline uptake follows saturable kinetics, with Km = 20.12 ± 3.14 μm and Vmax = 892.26 ± 39.03 pmol/105 cells per 10 min.C, Eadie–Hofstee plot. The data used inB are plotted as PRO uptake rate, V, versus V/[S]. These data were fit by linear regression to a line with Vmax(y-intercept) of 816.3 pmol/105 cells per 10 min andKm (− slope) of 20.7 μm.