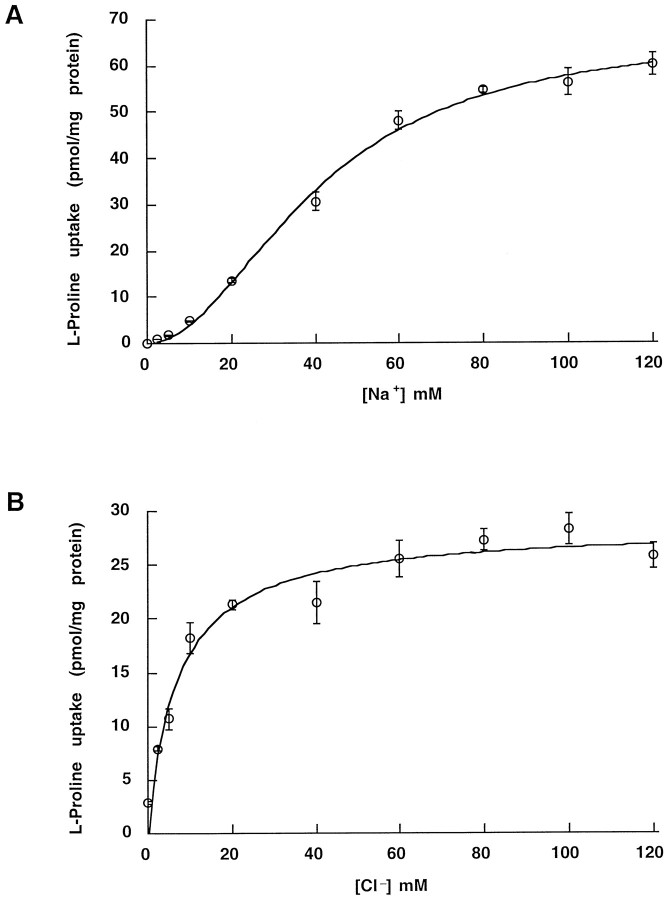
Fig. 3.
Na and Cl concentration dependence of proline uptake in HP-21 cells. Transport rates were measured by using a 10 min incubation as described in Materials and Methods. The standard assay buffer was modified by replacing NaCl with LiCl or Na-isethionate to reach the desired Na or Cl concentration. For each Na or Cl concentration the uptake measured into nontransfected HEK cells was taken as background. A, External [Na] was varied, and the data were fit to: V =Vmax[Na]n/(Kmn + [Na]n). The data were analyzed first by nonlinear curve fitting, with the Hill coefficient as a free parameter. After determining that the coefficient was close to two, we set it exactly to two and determined Vmax andKm. Holding at n = 2,Vmax = 67.41 ± 4.49 pmol/mg protein and Km = 40.7 ± 1.7 mm. B, External [Cl] was varied, and the data were fit as in A. The data were analyzed first by nonlinear curve fitting, with the Hill coefficient as a free parameter. After determining that the coefficient was close to one, we set it exactly to one and determined Vmax andKm. Holding at n = 1,Vmax = 28.46 ± 1.12 pmol/mg protein and Km = 7.0 ± 1.3 mm. The difference in maximal velocities represents a difference in expression level between batches of cells used in the two assays (n = 6). Expression levels decrease with increasing passage numbers.

