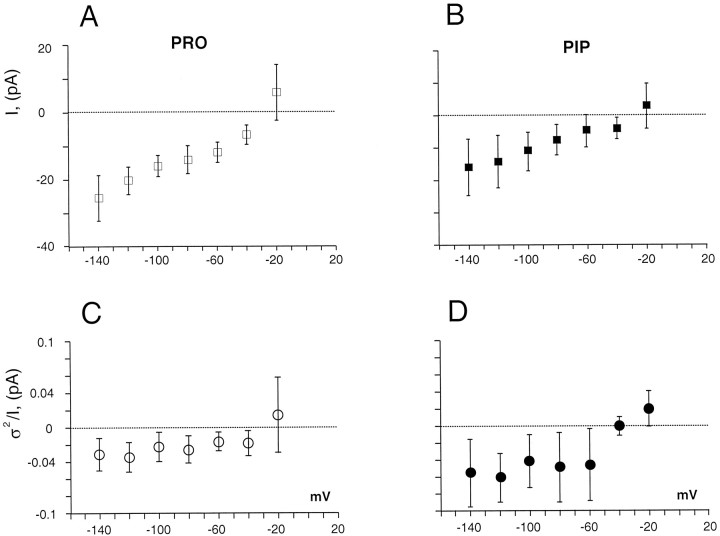
Fig. 5.
Steady-state I–V curves for PRO- and PIP-induced currents in HP-21 cells. A, Steady-stateI–V curve for PRO-induced currents was obtained from 500 msec test pulses that ranged from −120 to −20 mV in 20 mV increments. Substrate concentration was 40 μm. GGFL blocked substrate-induced currents at concentrations between 100 and 600 μm. The plot shows that GGFL-sensitive, PRO-induced currents apparently reverse for potentials between −10 and −30 mV. However, there is no significant positive current at any potential.B, The steady-state I–V curve for PIP-induced current was obtained by stepping the voltage for 500 msec from −140 to −20 mV, in 20 mV increments, from a −40 mV holding potential. The substrate concentration was 40 μm. GGFL blocked the substrate-induced current at concentrations of 100 μm. The plot shows a GGFL-blocked PIP-induced current, which also apparently reverses between −10 and −30 mV.C, The plot shows the difference variance of the PRO-induced current fluctuations, viz., ς2 = ς2PRO − ς2CO, at different voltages. The ratio of the difference variance to the mean steady-state current:I = IPRO −ICO, was plotted against the voltage. The value of the ratio ς2/I is not voltage-dependent. Using this procedure in 40 μm PRO, we were able to estimate the magnitude of the underlying events at different voltages. D, l-Pipecolate-induced current fluctuations followed the proline pattern. We estimated the increased variance as: ς2 = ς2PIP − ς2CO. An Axopatch 200A band limited with a four-pole Butterworth filter at 2000 Hz was used to measure currents. The ratio of the variance to the mean current (I =IPIP −ICO) ratio did not show voltage dependence. All data points represent means ± SD (n = 4).

