
Fig. 6.
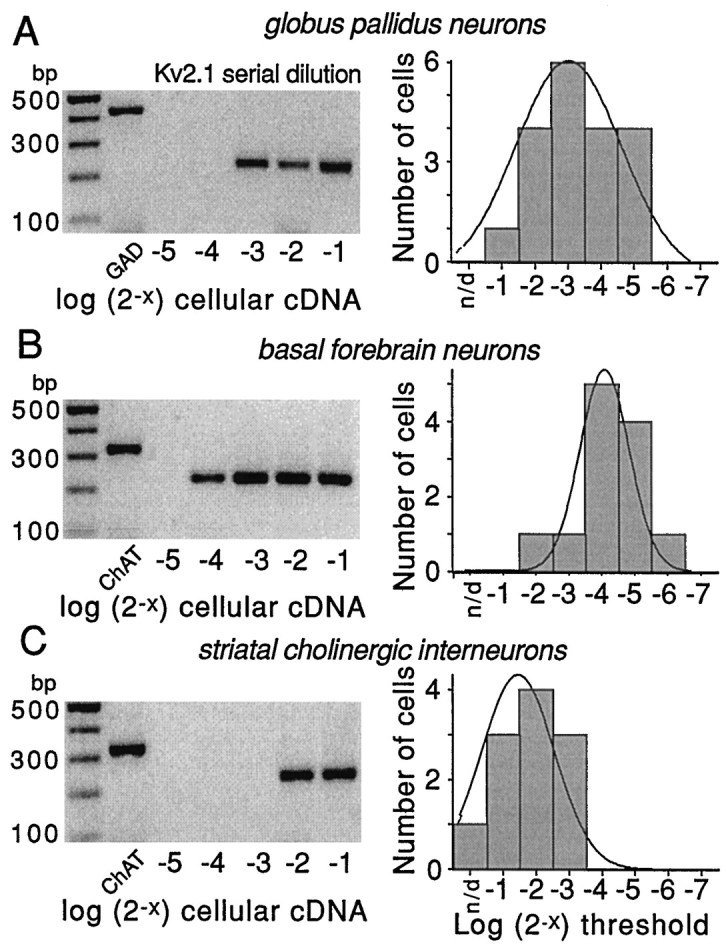
Serial dilution experiments demonstrate differences in Kv2.1 mRNA abundance in three cell types. Representative serial dilution gels for each cell type are shown on the left side of each panel. The first lane on theleft of gels is the marker; the second lane is a phenotyping transcript (GAD67 or ChAT). Thelast five lanes are Kv2.1 amplicons produced by runs with increasing fractions of total cellular cDNA (expressed in log2 units). Note that in all three cells the use of one-half of the total cellular cDNA resulted in detection. However, only 1/16th of the total cDNA was sufficient in basal forebrain cholinergic neurons. On the right side of each panel is the distribution of detection thresholds for Kv2.1 mRNA in that cell type. Note that Kv2.1 mRNA appeared to be most abundant in the basal forebrain cholinergic neurons, of intermediate abundance in GP neurons, and least abundant in striatal cholinergic interneurons. Thethin line is a Gaussian fit of the distribution.