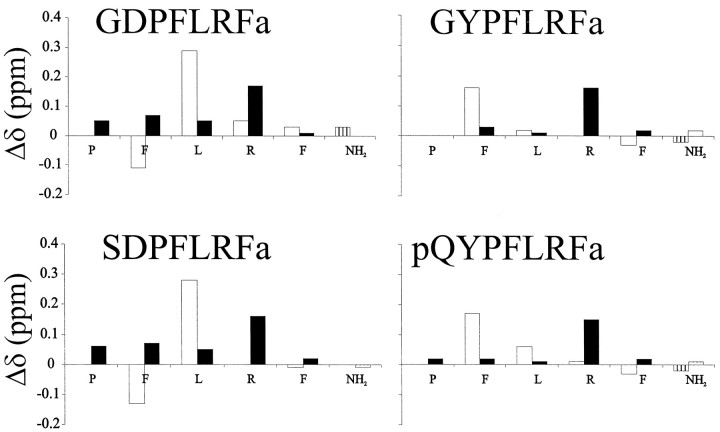
Fig. 1.
Deviations from random coil values (Wishart and Sykes, 1994) of HN (open bars) and Hα (solid bars) chemical shifts. The C-terminal amide values were subtracted from the average of all the values recorded in this study. Vertical axes are in parts per million, and the horizontal axes represent the conserved PNFLRF-NH2region of each peptide. The peptide pQYPFLRFa had a significant amount of overlap and conformational heterogeneity, preventing us from making complete assignments of all the side-chains, but the backbone assignments shown in Figure 1 are complete. Data were collected at approximately pH 5.5 and 4°C.

