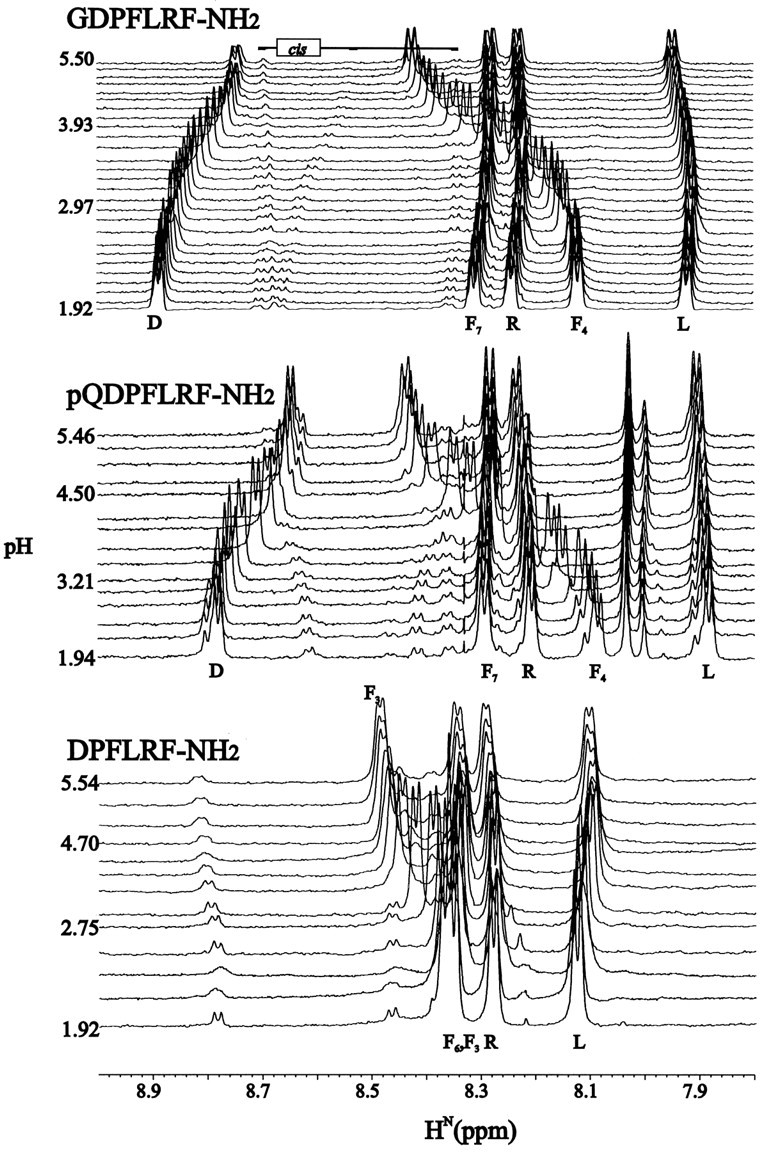
Fig. 3.

Amide regions of one-dimensional pH titrations for GDPFLRF-NH2 (top), pQDPFLRF-NH2(middle), and DPFLRF-NH2(bottom). The total magnitudes (highest pH minus lowest pH) of the changes in the phenylalanine chemical shift for each peptide studied are shown in Table 1. Series of one-dimensional 1H spectra are drawn from lowest to highest pH (bottom totop), with some of the values of pH indicated. Minor peaks in the spectra correspond to cis D–P peptide bonds. All data were collected at 4°C.
