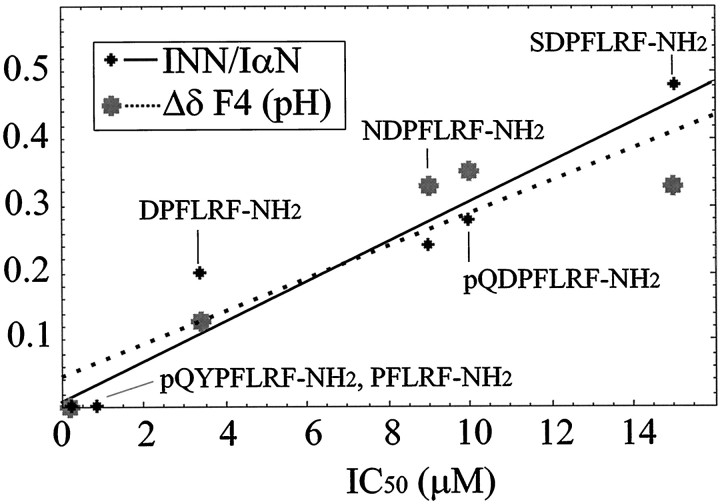
Fig. 5.
Plots ofINN/IαN(small black dots and solid line) and pH titration (large gray dots and dotted line) data versus IC50 measurements. The vertical axis is parts per million for the pH titration and unitless forINN/IαN. The IC50 data represent the concentration of peptide needed to displace 50% of 125I-daYFnLRF-NH2 from aHelix brain membrane preparation (Payza, 1987; Payza et al., 1989). TheINN/IαNand pH titration data are from Table 1 and are described in the text. Data were fit to linear equations, IC50 =a (NMR) + b(INN/IαNdata: a = 33.33, b = −0.27,r2 = 0.93; pH data:a = 41.67, b = −1.79,r2 = 0.82). A data point for the pH dependence of pQYPFLRF-NH2 at 0 ppm was added, because there is no titratable group and thus no pH dependence.

