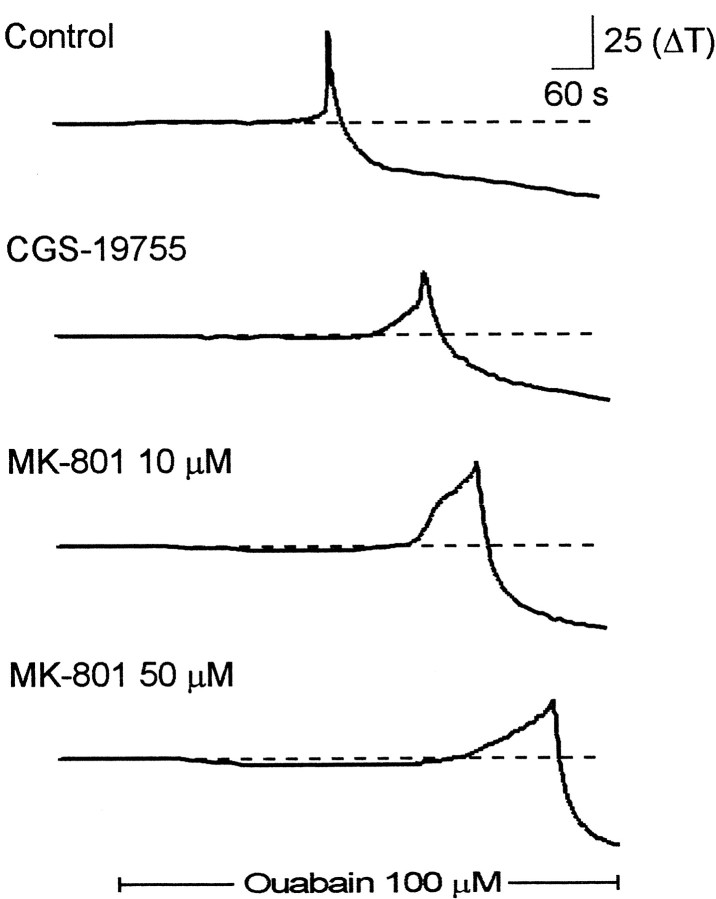
Fig. 2.
Time course of spreading depression in the presence of NMDA receptor antagonists. Each tracerepresents the change in transmittance in a single region of interest (as denoted in Fig. 1) recorded in separate brain slices. Thetop trace is a profile of spreading depression in a control slice. The bottom three traces are profiles of spreading depression in separate brain slices incubated in the indicated NMDA receptor antagonist. Both the competitive antagonist (CGS-19755) and the noncompetitive antagonist (MK-801) reduced the onset of SD, and the effects of MK-801 were dose-dependent.Solid bar represents the time of application of ouabain (100 μm).

