
Fig. 4.
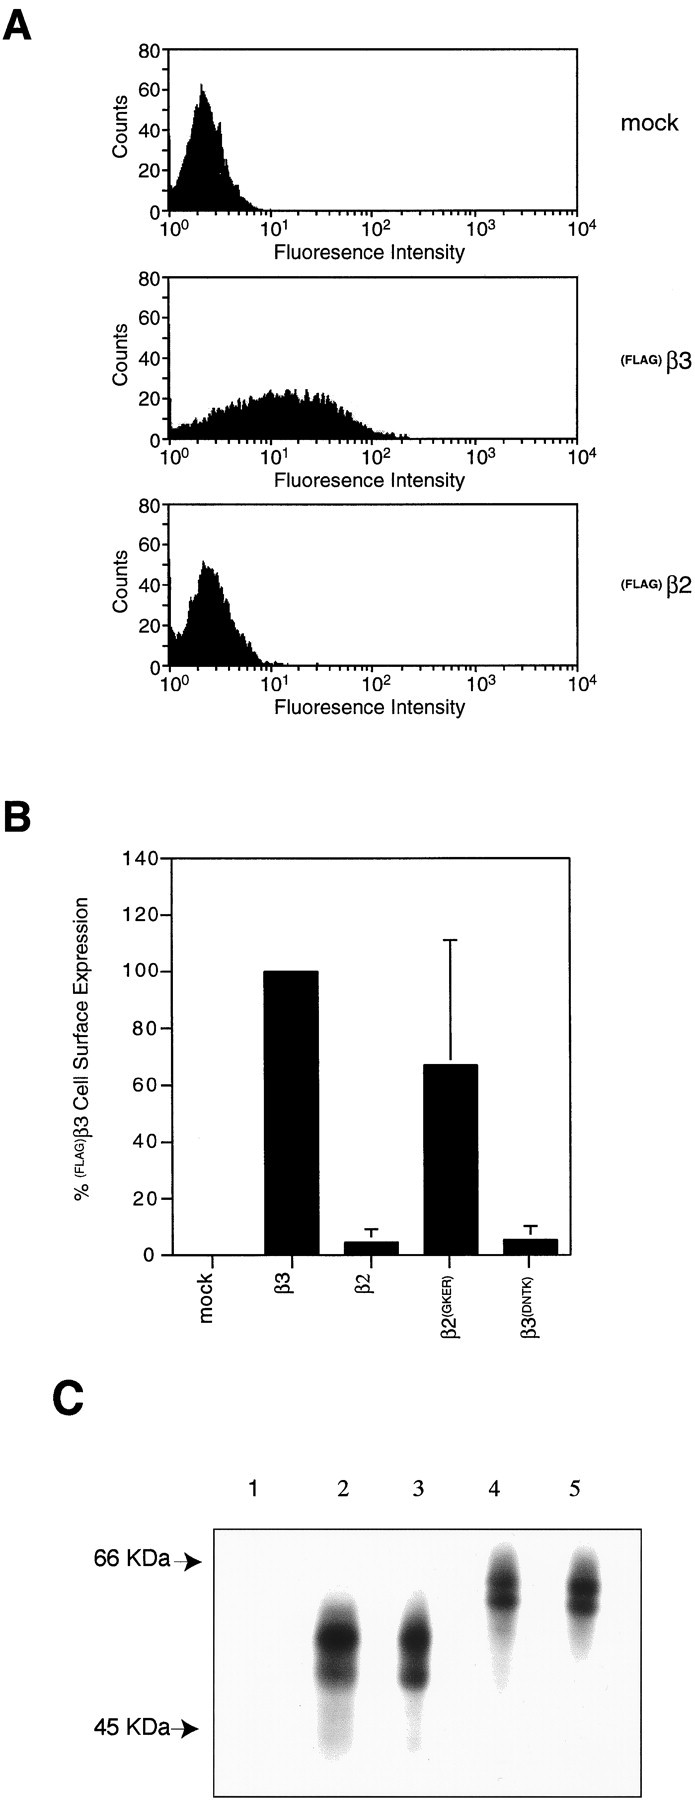
Quantitation of β subunit cell surface expression in A293 cells by FACS analysis. Cell surface β subunits were labeled by immunofluorescence on nonpermeabilized cells using anti-FLAG M2 mouse monoclonal antibody and an anti-mouse Alexa 488-conjugated secondary antibody. The cells were then subjected to flow cytometry analysis. A, Histograms showing the distribution of cells with different levels of cell surface fluorescence for mock-transfected cells (top panel) and cells transfected with either(FLAG)β3 (middle panel) or(FLAG)β2 (bottom panel) cDNAs.B, Relative levels of (FLAG)β subunit cell surface expression. The number of cells expressing the flag epitope on the cell surface was expressed as a percentage of the number of(FLAG)β3-transfected cells expressing the flag epitope on the cell surface (mock, n = 5;(FLAG)β3, n = 9;(FLAG)β2, n = 4;(FLAG)β2(GKER), n= 6; (FLAG)β3(DNTK),n = 5). C, Expression levels of(FLAG)β2 (lane 2),(FLAG)β2(GKER) (lane 3), (FLAG)β3 (lane 4),(FLAG)β3(DNTK) (lane 5), or control untransfected COS cells (lane 1) were assessed in COS cells labeled for 2 hr with 100 μCi/ml [35S]methionine. Expressing cells were then lysed, and receptor subunits were immunoprecipitated with FLAG antibody, resolved by SDS-PAGE, and visualized by autoradiography. The migration of molecular mass standards is indicated on theleft.