
Fig. 2.
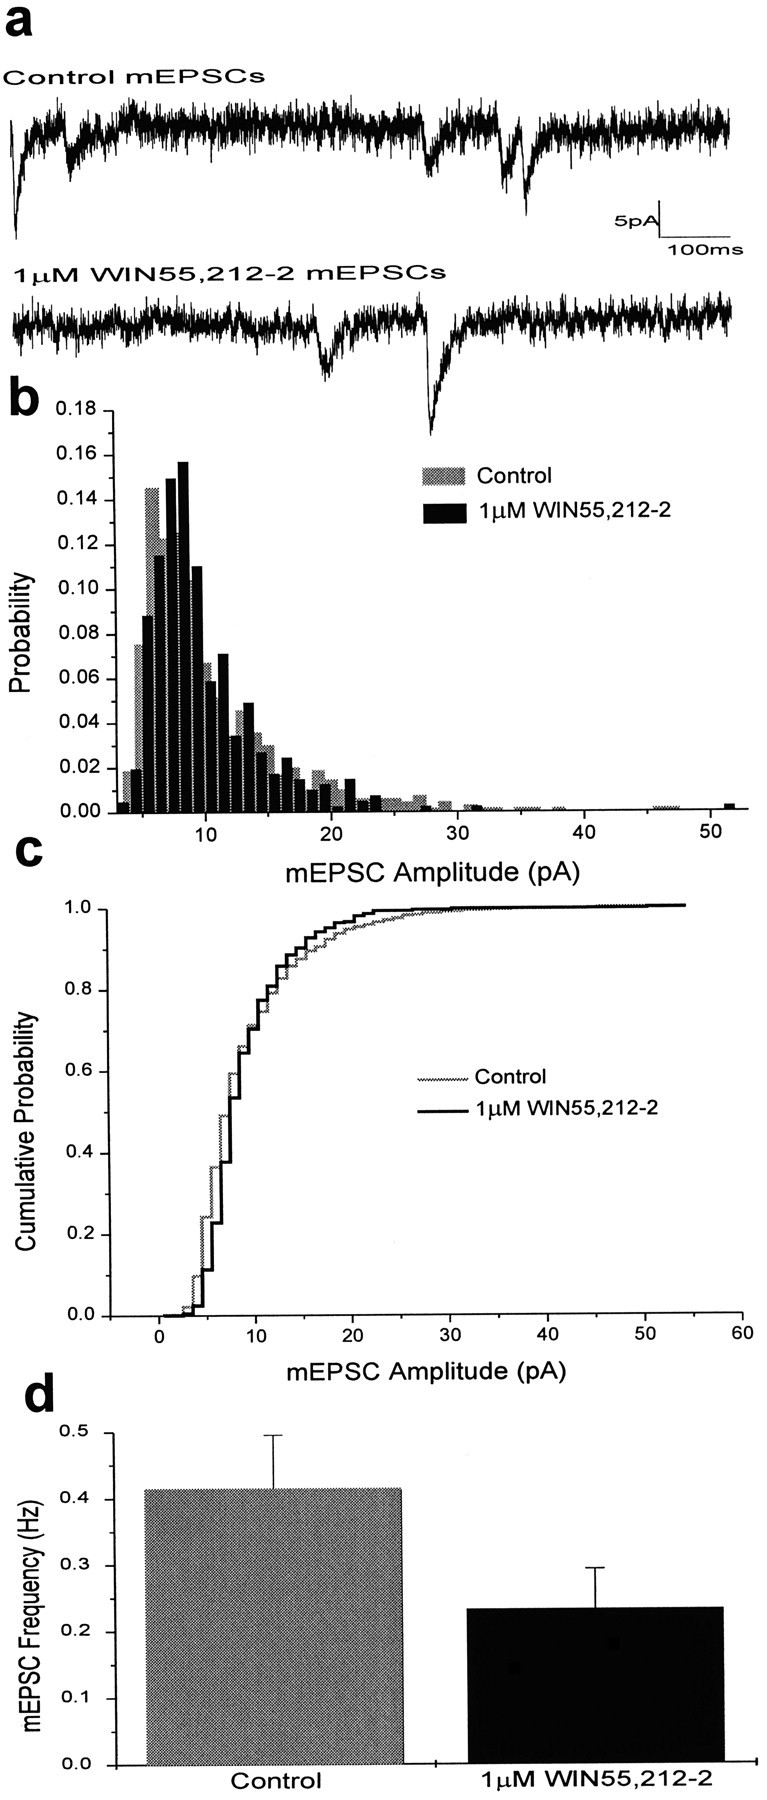
Cannabinoid receptor activation does not change the postsynaptic sensitivity to glutamate but does reduce mEPSC frequency. a, Sample traces of mEPSCs before and after application of 1 μm WIN55,212-2.b, Amplitude histogram of spontaneous mEPSCs. The threshold for peak detection was set between 5 and 10 pA. Data were binned in 1 pA intervals. The mean amplitude of mEPSCs was 9.93 ± 0.22 pA before (gray) and 10.04 ± 0.23 pA after (black) application of 1 μm WIN55,212-2 (n = 6). c, Cumulative probability histogram of mEPSC amplitude before (gray) and after (black) application of 1 μm WIN55,212-2. d, Bar graph showing average mEPSC frequency (mean ± SEM) before (gray) and after (black) application of 1 μm WIN55,212-2. The mean frequency of mEPSCs was 0.41 ± 0.08 Hz before WIN55,212-2 and 0.23 ± 0.06 Hz after WIN55,212-2 (p < 0.05, paired t test; n = 6).