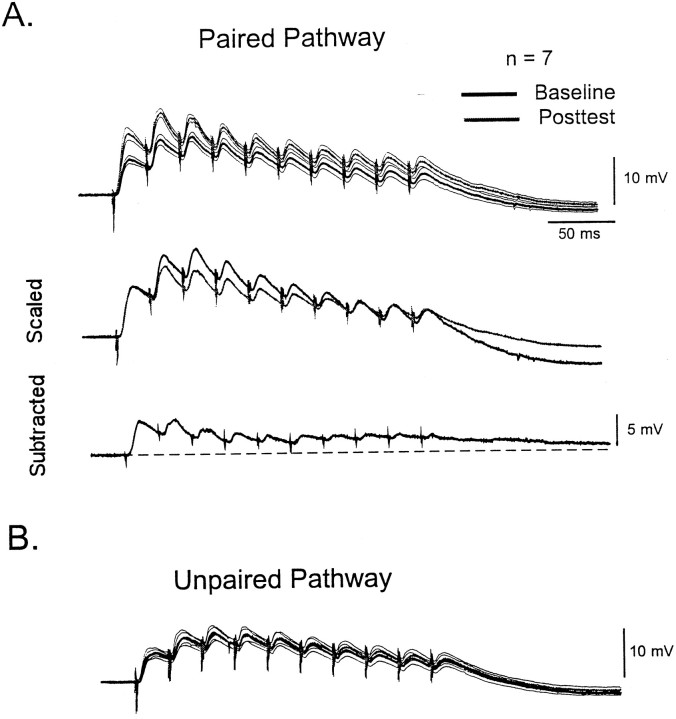
Fig. 3.
Interaction of LTP and STP in L-II/III neurons.A, Each trace represents the average response of seven neurons to the 40 Hz train before (black) and after (gray) the induction of LTP. The thin lines represent the SEM of the average trace. The middle traces are the same as those displayed above after scaling the first EPSP of the baseline response to the first EPSP of the posttest response. Note that for the second to fifth EPSPs the baseline responses are larger, indicating relatively less potentiation of these EPSPs. The bottom trace shows the subtraction of the baseline from the posttest trace. B, Average postsynaptic responses to the unpaired pathway in the same seven cells.

