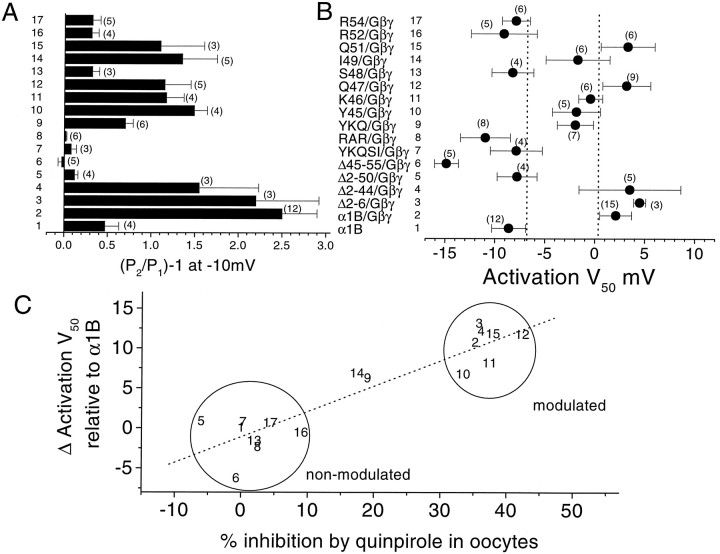
Fig. 7.
Mean effect of α1B deletions and mutations on Gβγ modulation in COS-7 cells. A, The P2/P1 ratio was determined in COS-7 cells overexpressing Gβ1γ2, from current amplitudes during steps to −10 mV before and after a depolarizing prepulse (+120 mV, 100 msec), for the same N-terminal deletions and point mutations shown in Figure 5. Comparison is made with α1B in the absence of Gβγ, recorded with 1 mm GDPβS in the patch pipette (1). The value [(P2/P1) − 1] is plotted, which will be 0 if there is no facilitation. B, The activation V50 was determined for the same constructs coexpressed with Gβ1γ2, and compared to the value for α1B in the absence of Gβγ, recorded with 1 mm GDPβS in the patch pipette (1). The dashed lines are 1 SEM more positive than the mean value for α1B (1), and 1 SEM more negative than the mean value for α1B/Gβγ (2). C,Correlation between Δ activation V50 (the data given in B, after subtraction of theV50 for α1B) on the y-axis, and the data from Figure 5C (percentage inhibition ofIBa by 100 nm quinpirole), on the x-axis. The numbers identifying the constructs refer to the bars in A and B. Regression analysis (dotted line) gives a coefficient,r of 0.92 (p < 0.001). The data divide into a group of modulated and a group of nonmodulated constructs, as identified, except for constructs 14 (I49A) and 9 (YKQ→AAA).

