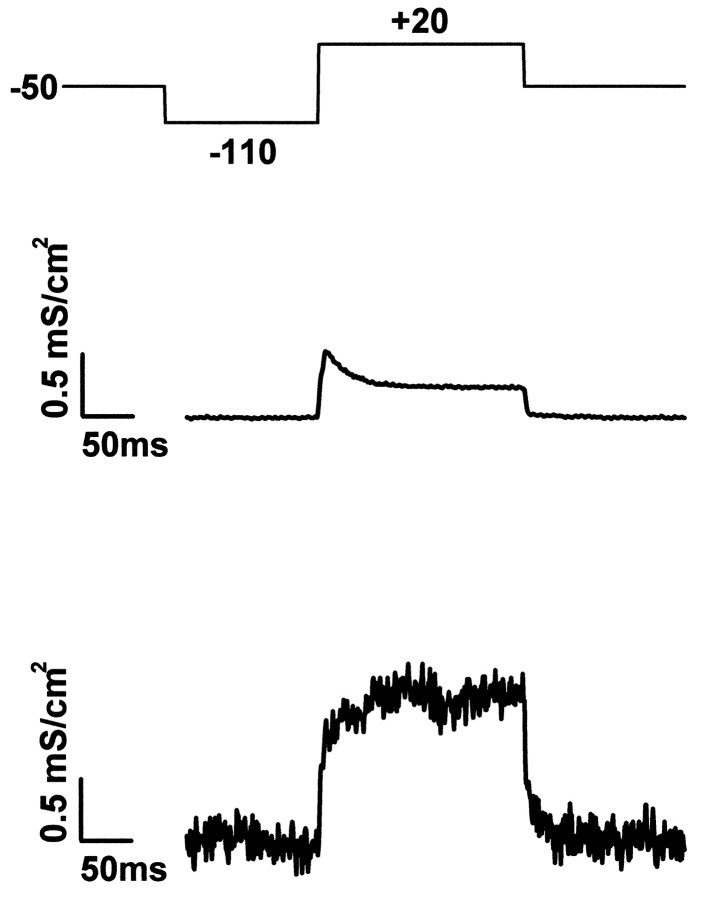
Fig. 5.
Specific membrane conductance.Top, Protocol of intracellular voltage. Center, Average specific potassium conductance gMKof the cell membrane with K-type and A-type conductance.Bottom, Specific potassium conductance gJMK of attached membrane region with enhanced K-type and without A-type conductance. Scaled records are from Figure 3.

