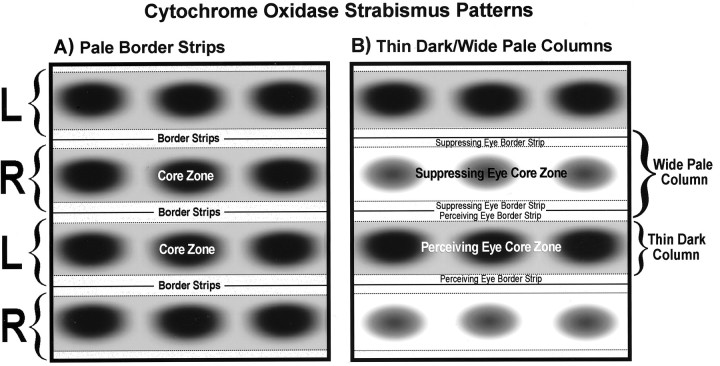
Fig. 12.
Schematic diagrams showing the two patterns of CO activity induced by strabismus. A, Pale border strips prevailed in regions of cortex where CO activity was lost in the binocular border strips, from disruption of ocular alignment, but metabolic activity remained strong in the monocular core zones serving each eye. This pattern was seen only in cortex representing the central 15° and was most evident in the two monkeys with a weak fixation preference. B, Thin dark alternating with wide pale columns were seen in cortex where CO activity was reduced in both eyes’ binocular border strips and one eye’s monocular core zones. Presumably, CO was lowered in the suppressed eye’s core zones. This pattern was seen throughout the cortex in animals with a strong fixation preference but only in the peripheral cortex of those with a weak fixation preference.

