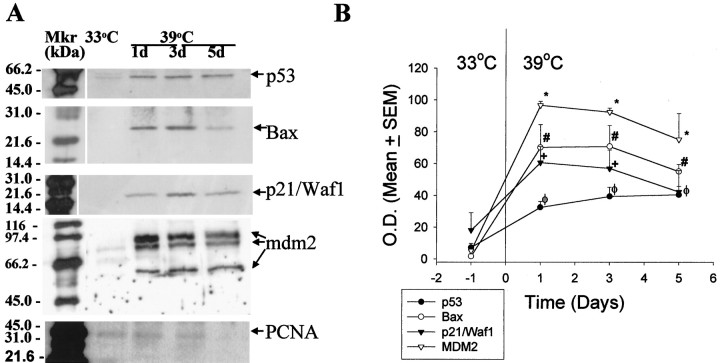
Fig. 2.
A, Representative samples of Western immunoblot analysis depicting the temperature-dependent expression of pp53, p21/Waf1, Bax, MDM2 (p85, p68, and p57 species) and PCNA. B, Graph represents densitometric analysis of pp53, Bax, p21/Waf1, and MDM2 (p85) expression. Asterisk indicates statistically significant difference relative to expression at 33°C. Mkr, Molecular weight marker; O. D., optical density.

