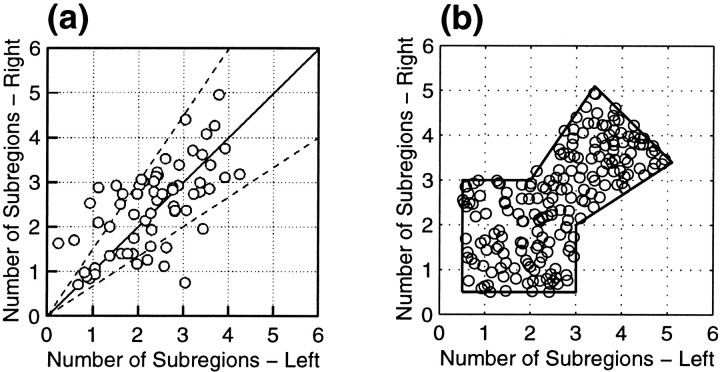
Fig. 3.
a, Observed distribution of the numbers of subregions in the left- and right-eye RFs from Ohzawa et al. (1996). Figure reproduced with permission of the American Physiological Society. b, For simulations we choose values with uniform probability within the outlined region, designed to approximately match the distribution in a. One hundred randomly chosen values illustrate the procedure.

