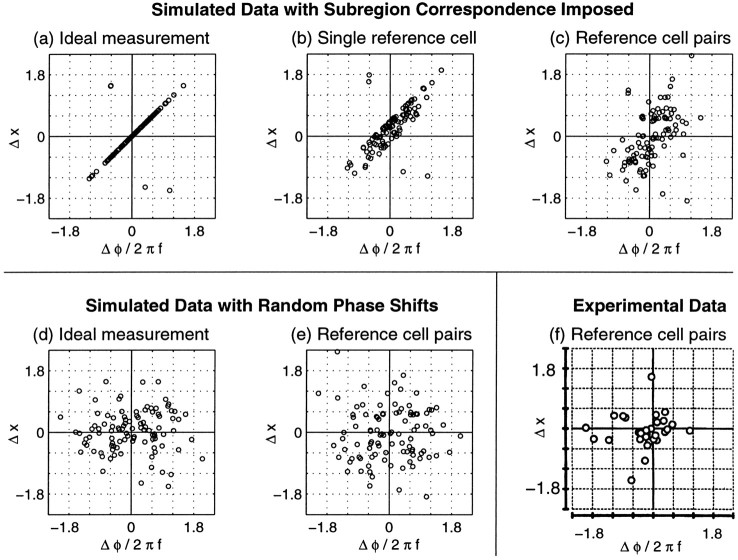
Fig. 8.
Simulated (a–e) and experimental (f) measurements of position shifts, Δxi, and “phase disparities,” Δφi/2πfi. The simulations in a–c are based on a single set of data from 100 cells in which subregion correspondence was imposed by Equation 8. As in Figure 7b, spatial frequencies were modeled on those observed in the experimental “reverse correlation” distribution, whereas position shifts were modeled on those observed in “mildly peripheral (8–12°)” area 17 (see Table 1). The simulations ind–e were based on a different set of data simulated with parameters identical to a–c except that left- and right-eye phases were independently chosen. a, In an ideal experiment, the measurements from each eye would be perfectly corrected for eye movements, and subregion correspondence would cause data from most cells to appear along the diagonal. The few points off the diagonal arise because of expression of all phase shifts in the range [−π, π]. b, Simulation in which RF measurements are made after superimposing the left and right RFs of a reference cell, which we have chosen to have a true position offset of ΔH = 0.40 and ΔV = −0.20°. Most data still lie near a line, but the distribution is broadened and shifted away from the origin.c, When cells are considered in pairs, using one cell as a reference cell for its partner, very little trace of the imposed relationship remains visible, although the majority of these data lie in a broad diagonal band running from the bottom left to top right quadrant. d, e, In simulated data with random phase shifts, points appear widely scattered, regardless of whether an ideal measurement is made (d) or position shifts are assessed by using reference cell pairs (e). f, Data fromAnzai et al. (1997) from cat visual cortex using an experimental method similar to the reference cell pair method simulated in c ande. Figure reproduced with permission of the National Academy of Science.

